Ethereum

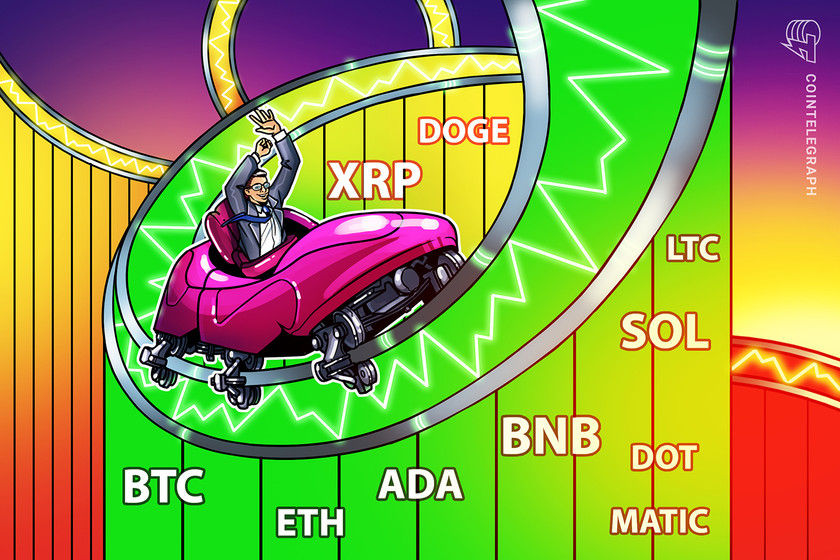
Price analysis 4/17: SPX, DXY, BTC, ETH, BNB, XRP, ADA, MATIC, DOGE, SOL

Bitcoin and select altcoins are witnessing a pullback, indicating that traders may be booking profits and reducing risk.

Pullbacks are a part and parcel of uptrends. They not only help shake out the weaker hands but also offer an opportunity for traders to add to their position or make fresh entries. Currently, Bitcoin (BTC) is witnessing a correction as bulls and bears battle for control, but is this a buying opportunity or the start of a trend reversal?

The Crypto Fear & Greed Index has risen to 69, indicating that traders have started to get greedy again. When this happens, it is time to become cautious in the near term, as when new traders begin chasing prices higher, experienced traders sell into strength and buy on dips.

Daily cryptocurrency market performance. Source: Coin360

ARK Invest CEO Cathie Wood said in a recent interview that Bitcoin and Ether (ETH) are being considered safe-haven assets like gold. Meanwhile, Bridgewater Associates founder Ray Dalio does not consider Bitcoin to be “an effective store hold of wealth or a medium of exchange.” He called it “a very, very poor alternative to gold.” This shows that some legacy investors are still uncertain about the future prospects of Bitcoin.

Will traders buy the dip in Bitcoin and the major altcoins, or could the correction deepen further? Let’s study the charts to find out.

S&P 500 index price analysis

The S&P 500 index (SPX) has been gradually moving toward the overhead resistance at 4,200. The price action of the past few days has formed an ascending triangle pattern, which will complete on a break and close above 4,200.

SPX daily chart. Source: TradingView

If that occurs, the index may start a new uptrend that has a target objective of 4,909. It is unlikely to be a straight dash higher because the buyers are likely to face stiff resistance at 4,300 and then again at 4,625.

Another possibility is that the price turns down from the current level or the overhead resistance at 4,200 and slips below the 20-day exponential moving average (EMA) (4,070). The index may then drop to the uptrend line of the triangle. If this support gives way, the advantage may turn in favor of the bears.

U.S. Dollar Index price analysis

The U.S. Dollar Index (DXY) bounced off the strong support at 100.82 on April 13, signaling that the bulls are fiercely defending the level.

DXY daily chart. Source: TradingView

The index has reached the 20-day EMA (102.32), where the bulls may face solid resistance from the bears. If the price turns down from the 20-day EMA, it will increase the possibility of a break below 100.82. The index will then complete a head-and-shoulders (H&S) pattern, which has a long-term target objective of 86.87.

Contrary to this assumption, if the price rises above the 20-day EMA, it will indicate strong buying near the 100.82 support. That may keep the index range-bound between the 200-day simple moving average (SMA) (106.33) and 100.82 for some more time.

Bitcoin price analysis

Bitcoin turned down from $31,000 on April 14, indicating profit-booking by the bulls. The bears will try to take advantage of the situation and tug the price to the 20-day EMA ($28,937).

BTC/USDT daily chart. Source: TradingView

If the price rebounds off the 20-day EMA, it will suggest that the sentiment remains positive and traders are viewing the dips as a buying opportunity.

The bulls will then make another attempt to propel the price to the stiff overhead resistance at $32,400. This remains the key level to watch for because a break and close above it may open the doors for a potential rally to $40,000.

This positive view will invalidate in the near term if the price plummets below the 20-day EMA. That may embolden the bears, who will then try to sink the BTC/USDT pair to $27,800 and later to $26,500.

Ether price analysis

Ether is in an uptrend, but it is facing resistance near the critical overhead level of $2,200. This suggests that some short-term traders may be booking profits after the strong rally in the past few days.

ETH/USDT daily chart. Source: TradingView

The ETH/USDT pair may dip down to the psychological support at $2,000 and then to the 20-day EMA ($1,930). In an uptrend, buyers generally try to defend the 20-day EMA during pullbacks.

In this case, if the price turns up from the 20-day EMA, it will suggest that lower levels are attracting buyers. That could enhance the prospects of a break above $2,200. If this level gives way, the pair may surge to $3,000.

Contrarily, if the price slumps below the 20-day EMA, it will indicate that the bulls are rushing to the exit. The pair may then descend to $1,680 and thereafter to the 200-day SMA ($1,482).

BNB price analysis

BNB (BNB) continued its northward journey and soared above the $338–$346 overhead resistance zone on April 16. However, the bulls are finding it difficult to latch on to the higher levels.

BNB/USDT daily chart. Source: TradingView

The bears are trying to pull the price back below the breakout level. If the price tumbles below $338, it may trap several aggressive bulls. That could result in a long liquidation, sinking the BNB/USDT pair to the 20-day EMA. If bulls want to keep the recovery intact, they will have to defend this level with vigor.

Alternatively, if the price turns up from the current level and rises above $350, it will indicate that bulls are in the driver’s seat. The pair may then climb to $360 and later to $400. This level is again likely to act as a formidable resistance.

XRP price analysis

After the failed attempt to thrust the price above the $0.56–$0.58 resistance zone on April 14, the bears are trying to start a correction in XRP (XRP).

XRP/USDT daily chart. Source: TradingView

If bears tug the price below the 20-day EMA ($0.50), the XRP/USDT pair may plunge to the 50% Fibonacci retracement level of $0.47. This level may witness strong buying by the bulls because if it cracks, the pair may collapse to the vital support at $0.43.

If bulls want to prevent this short-term bearish projection, they will have to drive the price above the overhead zone. If they do that, the pair may accelerate toward $0.65 and later extend the rally to $0.80.

Cardano price analysis

The up-move in Cardano’s ADA (ADA) halted near $0.46. The price may turn down and retest the breakout level from the inverse H&S pattern.

ADA/USDT daily chart. Source: TradingView

The rising 20-day EMA ($0.40) and the RSI near the overbought zone indicate that bulls have the edge. If the price snaps back from the neckline, it will suggest that bulls have flipped the level into support. The ADA/USDT pair may then resume its uptrend toward the pattern target of $0.60.

Contrary to this assumption, if the price continues lower and plunges below the neckline, it will suggest that the bears are active at higher levels. That may trap several aggressive bulls and sink the pair to the 200-day SMA ($0.35).

Related: Bitcoin sparks liquidations as analyst says BTC price may dip 12% more

Polygon price analysis

The bulls pushed Polygon’s MATIC (MATIC) above the resistance line of the symmetrical triangle pattern on April 16, but they are struggling to sustain the breakout.

MATIC/USDT daily chart. Source: TradingView

If bears succeed in pulling the price back below the resistance line, it will suggest a lack of demand at higher levels. The MATIC/USDT pair may then extend its stay inside the triangle for a few more days.

The 20-day EMA ($1.13) has turned up gradually, and the RSI is in the positive territory, indicating that the bulls are at a slight advantage. If the price turns up from the resistance line, it will indicate that the bulls have flipped the level into support. The pair may then rally to $1.30, where the bears may again mount a strong defense.

Dogecoin price analysis

The bears tried to stall Dogecoin’s (DOGE) recovery at the 38.2% Fibonacci retracement level of $0.09 between April 14 to 16, but the buyers did not cede ground to the sellers.

DOGE/USDT daily chart. Source: TradingView

The buyers asserted their supremacy and kicked the price above the overhead resistance on April 17, but the long wick on the candlestick shows that the sellers are protecting the 61.8% retracement level at $0.10.

Sellers will try to strengthen their position by dragging the price below the moving averages. If they succeed, the DOGE/USDT pair may stay inside the large range between $0.07 and $0.11 for a few more days.

Contrarily, if the price turns up from the current level and rises above $0.10, it will suggest that bulls are attempting a comeback. The pair may then rise to the crucial resistance at $0.11. A break above this level will signal a possible pick-up in momentum.

Solana price analysis

Solana’s SOL (SOL) has been sustaining above the downtrend line since April 11, indicating that the bulls are in no hurry to book profits.

SOL/USDT daily chart. Source: TradingView

The 20-day EMA has started to turn up, and the RSI is in the positive zone, indicating that the bulls have the upper hand. However, the bears are unlikely to give up easily. They will try to guard the overhead resistance at $27.12.

If the price turns down sharply from this level, the SOL/USDT pair may fall to the 20-day EMA. If the price rebounds off the 20-day EMA with strength, it will enhance the prospects of a rally toward $39.

On the contrary, if the price breaks below the 20-day EMA, it will suggest that the pair may oscillate between $15.28 and $27.12 for a while longer.

The views, thoughts and opinions expressed here are the authors’ alone and do not necessarily reflect or represent the views and opinions of Cointelegraph.

This article does not contain investment advice or recommendations. Every investment and trading move involves risk, and readers should conduct their own research when making a decision.

Price analysis 4/14: BTC, ETH, BNB, XRP, ADA, DOGE, MATIC, SOL, DOT, LTC

Bitcoin hit a year-to-date high at $31,000 and ETH’s price followed. Which altcoins will be next?

Bitcoin (BTC) and Ether (ETH) are trading above the psychologically important levels of $30,000 and $2,000, respectively, suggesting the crypto winter may be on its last legs. 

Some analysts are calling for an altseason to begin, but it may be too early for that. When most crypto bears turn bullish, Bitcoin will likely turn down sharply and catch the late entrants off guard. That could hurt sentiment in the short term and cause a sell-off in altcoins. After the weak hands are shaken out, the crypto markets may stabilize and begin a sustained uptrend.

Daily cryptocurrency market performance. Source: Coin360

Data from on-chain intelligence platform Glassnode suggests that there are significant similarities between the current having cycle and the previous ones. However, Ecoinometrics warned that an economic recession could alter things.

Let’s watch the charts of the top 10 cryptocurrencies to spot the critical resistance levels that may start a pullback.

Bitcoin price analysis

The bears tried to stall the up-move on April 12 but the bulls did not give up. They resumed their purchases on April 13 and cleared the hurdle at $30,550 on April 14.

BTC/USDT daily chart. Source: TradingView

If buyers sustain the price above $30,550, the BTC/USDT pair may rally to $32,400. The bears are expected to protect this level with all their might.

If the price turns down from this level but does not break below the 20-day exponential moving average (EMA) at $28,542, it will enhance the prospects of a rally above $32,400. If this level is scaled, the pair may zoom toward $40,000.

On the other hand, if the 20-day EMA cracks, it will suggest that the bears are trying to make a comeback. That could clear the path for a possible drop to $25,250.

Ether price analysis

Ether bounced off the 20-day EMA ($1,870) on April 12, indicating that the bulls are vigorously guarding the level.

ETH/USDT daily chart. Source: TradingView

The buying continued on April 13, with the bulls pushing the price above the psychologically important level of $2,000. That attracted further buying, with the ETH/USDT pair climbing toward $2,200. This is a crucial level for the bears to defend because if they fail to do that, the pair may witness a buying stampede. The pair could then skyrocket to $3,000.

Conversely, if the price turns down from $2,200 and breaks below $2,000, the pair may tumble to the 20-day EMA. This is an important level to keep an eye on because a break below it may pull the pair to $1,680.

BNB price analysis

The bulls did not allow BNB (BNB) to dip below the 20-day EMA ($317) on April 12 and 13. This indicates that the sentiment is turning positive and traders are buying the dips.

BNB/USDT daily chart. Source: TradingView

The 20-day EMA has started to turn up and the relative strength index (RSI) has jumped above 60, suggesting that the tide is turning in favor of the bulls.

Buyers will try to solidify their position by catapulting the price above the $338 to $346 overhead zone. If they manage to do that, the BNB/USDT pair may pick up momentum and rally to $360 and subsequently to $400.

On the contrary, if the price turns down from the overhead zone, it will suggest that the bears are active at higher levels. That may keep the pair stuck between the 20-day EMA and $346 for some time.

XRP price analysis

Buyers successfully protected the 38.2% Fibonacci retracement level of $0.49. That attracted further buying in XRP (XRP), which pushed the price toward the overhead resistance zone of $0.56 to $0.58.

XRP/USDT daily chart. Source: TradingView

The upsloping 20-day EMA ($0.49) and the RSI in the positive zone indicate that bulls have a slight edge. If buyers kick the price above $0.58, the XRP/USDT pair may start an up-move that could reach $0.65 and then $0.80.

Contrarily, if the price turns down from the overhead zone, it will suggest that the pair may consolidate between $0.49 and $0.58 for a few days. The trend will favor the bears if they yank the price below $0.49.

Cardano price analysis

Cardano (ADA) soared above the neckline of the inverse head-and-shoulders (H&S) pattern on April 13, completing the reversal setup.

ADA/USDT daily chart. Source: TradingView

Usually, the price turns down after the breakout from a pattern and retests the breakout level. In this case, the ADA/USDT pair may dip to the neckline. If the price rebounds off this level, it will suggest that the bulls have flipped the level into support. That may start an up-move toward the pattern target of $0.60.

Contrary to this assumption, if the price turns down sharply and breaks below $0.37, it will suggest that the breakout above the neckline was a fake out. The pair may then plunge to $0.30.

Dogecoin price analysis

Dogecoin (DOGE) bounced off the moving averages on April 12, as seen from the long tail on the day’s candlestick.

DOGE/USDT daily chart. Source: TradingView

The bulls tried to drive the DOGE/USDT pair above the 38.2% Fibonacci retracement level of $0.09 but the bears did not budge. This suggests that the sentiment remains negative and traders are selling on rallies.

Buyers must push and sustain the price above $0.09 to indicate that the selling pressure may be reduced. The pair may then ascend to the 61.8% retracement level of $0.10. Usually, a break and close above this level results in a 100% retracement. If that happens, the pair may soar to $0.11.

Polygon price analysis

Polygon (MATIC) slipped below the support line of the symmetrical triangle pattern on April 12 but the long tail on the candlestick shows that the bulls aggressively bought at lower levels.

MATIC/USDT daily chart. Source: TradingView

The MATIC/USDT pair turned up and broke above the 20-day EMA ($1.11) on April 13. That may have trapped the aggressive bears, resulting in a short squeeze. The pair reached the resistance line of the triangle on April 14, where the bears are posing a strong challenge.

If bulls thrust the price above the triangle, the rally may reach the resistance at $1.30. This level may again prove to be a strong hurdle, but if crossed, the up-move could reach $1.60. This positive view will invalidate in the near term if the price turns down and plunges below $1.08.

Related: BTC price targets see $33K next as Bitcoin eyes key resistance flip

Solana price analysis

The bulls have built upon the breakout from the downtrend line in Solana (SOL). This shows demand at higher levels.

SOL/USDT daily chart. Source: TradingView

The rising 20-day EMA ($21.74) and the RSI near the overbought zone indicate an advantage to buyers. The SOL/USDT pair could rise to $27.12, where the bears may mount a strong defense. If bulls overcome this barrier, the pair may resume its climb toward $39.

On the downside, the downtrend line is the key level to watch out for. The bears must sink and sustain the price below the downtrend line to trap the aggressive bulls. The pair may then collapse to $15.28.

Polkadot price analysis

The long tail on the April 12 candlestick shows that the bulls purchased the dip to the 20-day EMA ($6.32). Polkadot (DOT) continued its northward march and broke above the downtrend line on April 13 but the bulls are facing selling at higher levels.

DOT/USDT daily chart. Source: TradingView

The DOT/USDT pair turned down from the 61.8% Fibonacci retracement level of $6.85, with the bears trying to tug the price back below the downtrend line. If they do that, the pair may drop to the 20-day EMA. A break below this level may sink the pair to the crucial support at $5.70.

Conversely, if the price turns up and closes above $6.85, it may propel the price to the neckline of the inverse H&S pattern. If bulls pierce this overhead resistance, the pair may start a new uptrend.

Litecoin price analysis

Litecoin (LTC) turned up from the 20-day EMA ($91) on April 13, indicating that the bulls continue to view the dips as a buying opportunity.

LTC/USDT daily chart. Source: TradingView

The bulls tried to strengthen their position further by pushing the price above the immediate resistance at $96 on April 14 but the long wick on the day’s candlestick shows that the bears are aggressively selling on rallies.

If bears yank the price below the 20-day EMA, it could trap several aggressive bulls. The LTC/USDT pair may then slump to $85. On the other hand, if the price turns up and sustains above $96, it will open the gates for a potential rally to $106.

The views, thoughts and opinions expressed here are the authors’ alone and do not necessarily reflect or represent the views and opinions of Cointelegraph.

This article does not contain investment advice or recommendations. Every investment and trading move involves risk, and readers should conduct their own research when making a decision.

Bitcoin’s dominance knocked by ETH’s post-Shapella rally

Bitcoin’s percentage of the total cryptocurrency market retreated by nearly 1% on April 14, while Ether gained just over 1.1%.

Ether (ETH) prices have topped the psychological $2,000 level following the Shapella upgrade this week and the result is a decline in Bitcoin (BTC) market dominance.

According to data from the analysis site btctools.io, Ether’s market share had climbed to 19.8%, an over 1.1% boost, in the last 24 hours at the time of writing on April 14, while Bitcoin’s dominance had slid by just under 1%. Since the beginning of the year, ETH dominance has increased by 7.6%.

Bitcoin’s market dominance has fallen to 47.7% as Ethereum’s market share increased. The post-Shapella ETH rally has knocked BTC off an almost two-year high in terms of market share.

BTC’s market share tapped 48.8% on April 12 following its rally to $30,000, the highest it’s been since July 2021, when it came just shy of 50%. Additionally, BTC has not been over 50% dominant since April 2021.

Bitcoin’s dominance remains up 13.6% since the beginning of the year, according to TradingView data.

Chart plotting Bitcoin’s dominance since late 2022. Source: TradingView

The market share rise in both BTC and ETH has been at the expense of altcoins, most of which have been lackluster during the recent rally of the two top coins.

Bitcoin and Ether combined represent around 68% of the total crypto market. Roughly 10% of the market are stablecoins, meaning the other 10,800 or so tokens, as listed on the price analytics platform CoinGecko, have a combined share of just 22%.

The market cap share of the top coins over one month shows a slight increase for ETH and a decrease for BTC. Source: CoinMarketCap

Market dominance is calculated by looking at an asset’s market capitalization compared with the total crypto market cap, which is currently at an eleven-month high of $1.33 trillion.

Related: Bitcoin dominance nears 50% as research hails ‘bullish’ narrative flip

Ether (ETH) has surged 10.25% over the past 24 hours. As a result, the asset tapped an eleven-month high of $2,122 during the April 14 morning Asian trading session, according to Cointelegraph data.

Ether momentum has been driven by a successful Shapella upgrade on April 12, which released staked ETH on the Beacon Chain.

BTC has managed a 2% gain on the day, reaching an intraday high of $30,862 during the April 14 morning Asian trading session.

Magazine: ‘Account abstraction’ supercharges Ethereum wallets: Dummies guide

Can Ethereum crack $2K? ETH price inches closer despite new unlocked supply

Ethereum staking withdrawals are gathering momentum but have not been able to cause a major sell-off as many anticipated post-Shapella upgrades.

The price of Ethereum’s Ether (ETH) token edged toward $2,000 a day after the launch of the network’s long-anticipated Shapella upgrade.

Ethereum ducks sell-the-news fears

On April 13, Ether’s price gained roughly 4% to reach an intraday high of $1,996 on Coinbase, ignoring the potential sell-off pressure the Shapella upgrade could potentially bring to the market.

ETH/USD daily price chart. Source: TradingView

To recap: The Shanghai hard fork, also known as “Shapella,” enables users to withdraw their ETH from Ethereum’s proof-of-stake smart contract.

As of 9:00 am UTC on April 13, over 98,000 ETH worth around $194.8 million has left Ethereum’s voting balance reserves since the Shanghai launch a day ago, according to Nansen. In other words, nearly $200 million in potential selling pressure has entered the market.

ETH deposits vs. withdrawals. Source: Nansen

But Ether’s price rise since Shanghai suggests that the market has had no problem absorbing any selling pressure arising from this event so far. It’s also possible that most users have decided to hold onto their ETH staking rewards rather than sell them in anticipation of further gains.

About 15% of Ethereum’s total supply in circulation, nearly 120.4 million ETH, is currently staked.

Interestingly, more than 70% of the ETH staked is still underwater compared to current price levels, according to data gathered by Dune Analytics. This reduces the possibility of a sell-off in the near term from Shanghai’s staking withdrawals.

Ethereum price risks 10% correction

The ongoing run-up in the Ethereum market has left ETH/USD slightly overbought, raising the likelihood of a short-term price correction this month.

Related: When levees break, liquidity flows — Analyzing Ethereum Shapella and liquidity staking derivatives

Notably, ETH’s daily relative strength index (RSI) is merely two points below its overbought threshold of 70. In addition, ETH/USD tested a critical resistance level near $1,990, which preceded price pullbacks in May and August 2022.

ETH/USD daily price chart. Source: TradingView

A repeat of this scenario likely means a correction toward its 50-day exponential moving average (50-day EMA; the red wave) near $1,750 in April, down about 10% from the current price levels. This ETH price level is also close to the historical support/resistance line.

Conversely, a decisive breakout above $2,000 — a psychological resistance level — could have Ether price start its potential climb toward $3,000.

This article does not contain investment advice or recommendations. Every investment and trading move involves risk, and readers should conduct their own research when making a decision.

Ethereum’s Shapella hard fork executed on mainnet

After months of delays, Ethereum validators can finally withdraw their staked Ether and rewards from the Ethereum mainnet.

The Shapella hard fork has officially been executed on the Ethereum mainnet — meaning that Ethereum validators can finally withdraw their staked Ether (ETH) from the Beacon Chain.

The long-awaited upgrade took effect at 10:27 pm UTC on April 12 at epoch number 194,048.

Within the first hour of the hard fork, a total of 12,859 Ether were unlocked in 4,333 withdrawals, according to Ethereum block explorer beaconchai.in.

The number of withdrawals, Ether processed and the number of withdrawal validators. Source: beaconcha.in

Currently, around 44% of validators, or 248,043 of the total active 559,549, can request a partial or full withdrawal.

The majority of withdrawals at this time range between 2.8 to 3.2 ETH, which suggests that it’s mostly staking rewards that are being withdrawn at this time.

The withdrawals come as only 3,996 validators signed up to the exit queue moments before the Shapella hard fork took effect, according to data from Rated Network Explorer.

Of the total amount of withdrawable Ether, crypto exchange Huobi holds the largest share at 30%, followed by the decentralized autonomous organization PieDAO at 17.7%, according to data from blockchain analytics firm Nansen.

Total number of withdrawable Ether by entity. Source: Nansen

A total of 284,622 Ether is awaiting a full withdrawal from 7,948 validators, Nansen data shows.

The price of Ether, currently $1,920, has barely moved within the first hour of the hard fork something which was predicted in an April 11 report from blockchain intelligence platform Glassnode.

The hard fork can theoretically unlock 18.1 million Ether on the Beacon Chain currently equating to over $34.8 billion, however, several mechanisms are in place to prevent a flood of ETH from hitting the market, according to the Ethereum Foundation.

Related: Less than 1% of staked ETH estimated to sell after Shanghai upgrade: Glassnode

In its report, Glassnode estimated that less than 1% of that total would be released over the first week and the 12,859 Ether unlocked within the first hour only represents 0.07% of the total Ether staked in the Beacon Chain.

Through Ethereum Investment Proposal EIP-4895, staked Ether was pushed from the Beacon Chain to the Ethereum Virtual Machine (EVM) otherwise known as the execution layer, making withdrawals possible.

It is the most significant upgrade since the Merge on Sept. 15 and it moves Ethereum one step closer towards a fully functional proof-of-stake system.

Magazine: ‘Account abstraction’ supercharges Ethereum wallets: Dummies guide

Update (April 12, 11:52 pm UTC): This article has been updated to include Ethereum validator withdrawal figures immediately following the Shapella hard fork.

Update (April 13, 12:20 am UTC): This article has been updated with further information, metrics and background information.

Price analysis 4/12: BTC, ETH, BNB, XRP, ADA, DOGE, MATIC, SOL, DOT, LTC

Today’s CPI report highlighted a slight decline in inflation, a development which could put a strong price floor beneath Bitcoin and select altcoins.

The March consumer price index climbed marginally by 0.1%, below economists’ expectation of a 0.2% increase and February’s advance of 0.4%. Although inflation is showing signs of slowing, the year-on-year CPI increased by 5%, well above the U.S. Federal Reserve’s 2% target. 

The FedWatch Tool shows a 67% probability of a 25 basis point rate hike in the Fed’s May meeting, but by the end of the year, the majority of the market participants have come to expect rates to be lower than the current level.

Daily cryptocurrency market performance. Source: Coin360

An expansive monetary policy is usually positive for risky assets. In addition, crypto traders will focus on Bitcoin’s (BTC) halving, which is set to occur next year. That is also likely to be a positive for cryptocurrency prices. While the near-term picture is uncertain, the long term remains bullish.

Will traders book profits in the near term, pulling Bitcoin and altcoins lower, or will the rally extend further?

Let’s study the charts of the top-10 cryptocurrencies to find out.

Bitcoin price analysis

Bitcoin is witnessing resistance near $30,550, but a positive sign is that the bulls have not given up much ground. This suggests that the buyers are not rushing to the exit.

BTC/USDT daily chart. Source: TradingView

The bears are unlikely to give up without a fight. They will try to yank the price below the 20-day exponential moving average ($28,163), which remains the key support level to keep an eye on. If they are successful, the selling could pick up and the BTC/USDT pair may slump to the support at $25,250.

Conversely, if the price continues to move up from the current level or rebounds off the 20-day EMA, it will signal strong demand at lower levels. That will enhance the prospects of a rally to $32,400, which is likely to behave as a formidable resistance.

Ether price analysis

Ether (ETH) snapped back from the 20-day EMA ($1,831) on April 9, but the bulls could not push the price above the immediate resistance at $1,943.

ETH/USDT daily chart. Source: TradingView

If the price turns down from the current level and breaks below $1,824, the ETH/USDT pair will form a double top in the short term. That may tug the price down to the strong support at $1,680.

If bears want to keep the uptrend intact, they will have to protect the 20-day EMA and force the pair above the resistance at $1,943. If they can pull it off, the pair may resume its up-move. The $2,000 level may offer a resistance but it is likely to be crossed. The pair may then rally to $2,200.

BNB price analysis

BNB (BNB) surged above the $318 resistance on April 11, but the long wick on the candlestick shows that the bears are selling near $338.

BNB/USDT daily chart. Source: TradingView

The 20-day EMA ($315) is flattish and the RSI is turning down toward the center. This indicates a potential range-bound action in the near term. If the price slips below the 20-day EMA, the BNB/USDT pair may oscillate between $338 and the 200-day SMA ($292) for a few days.

Another possibility is that the price rebounds off the 20-day EMA with strength. That will suggest buying on dips. The bulls will then again try to kick the pair above the overhead zone between $338 and $346.

XRP price analysis

The long wick on XRP’s (XRP) April 11 candlestick shows that the bears are trying to stall the recovery at $0.53.

XRP/USDT daily chart. Source: TradingView

Sellers will try to strengthen their position by pulling the price below the 20-day EMA ($0.49). If they are successful, several short-term bulls may be forced to close their positions. The XRP/USDT pair may then slump toward the next support at $0.43.

Instead, if the price rebounds off the 20-day EMA, it will suggest that bulls continue to view the dips as a buying opportunity. The bulls will have to overcome the stiff resistance at $0.53 to regain the upper hand.

Cardano price analysis

Cardano (ADA) turned down from the neckline of the inverse head and shoulders (H&S) pattern, indicating that the bears are trying to halt the recovery at this level.

ADA/USDT daily chart. Source: TradingView

The 20-day EMA ($0.38) is an important level to watch out for on the downside. If the price bounces off this level, it will suggest that the sentiment remains positive and traders are buying on dips.

That will increase the likelihood of a break above the neckline. If that happens, the reversal pattern will complete. The ADA/USDT pair may then start a new uptrend toward $0.60.

Conversely, if the pair plummets below the 20-day EMA, it will suggest that the short-term traders are booking profits. That may sink the pair to the 200-day SMA ($0.35).

Dogecoin price analysis

Dogecoin’s (DOGE) rebound off the moving averages could not even reach the 38.2% Fibonacci retracement level of $0.09. This suggests that the bears are selling on every minor rise.

DOGE/USDT daily chart. Source: TradingView

The DOGE/USDT pair has slipped back to the moving averages, which shows that bears are trying to strengthen their position. If they yank the price below the moving averages, the pair may fall to the crucial support at $0.07.

On the other hand, if the price once again rebounds off the moving averages, it will suggest that the bulls are aggressively protecting the level. Buyers will then make one more attempt to push the price toward the $0.11 level.

Polygon price analysis

The bears are trying to sink Polygon (MATIC) below the support line of the symmetrical triangle pattern.

MATIC/USDT daily chart. Source: TradingView

If they succeed, it will suggest that the supply exceeds demand. The MATIC/USDT pair may then descend toward the 200-day SMA ($0.99), which is an important level to keep an eye on. If this level gives way, the pair may start a downtrend.

Contrarily, if the price turns up from the current level and breaks above the 20-day EMA ($1.11), it will suggest that the breakdown may have been a bear trap. The pair may then attempt to rise above the resistance line of the triangle.

Related: Why is Dogecoin (DOGE) price down today?

Solana price analysis

After hesitating for several days, Solana (SOL) finally soared above the downtrend line on April 11. This is the first indication that the downtrend may be ending.

SOL/USDT daily chart. Source: TradingView

Usually, after breaking out of a significant resistance, the price turns down and retests the level. In this case, the price may dip down to the breakout level. If the price rebounds off the downtrend line, it will suggest that the bulls have flipped the level into support. That will enhance the prospects of a potential rally to $27.12 and thereafter to $39.

This positive view will invalidate if the price turns down and breaks below the downtrend line. Such a move will suggest that the breakout may have been a bull trap. The SOL/USDT pair may then tumble to $15.28.

Polkadot price analysis

Polkadot (DOT) turned down from the downtrend line on April 12, indicating that the bears are fiercely guarding this level.

DOT/USDT daily chart. Source: TradingView

If the price dips and sustains below the 20-day EMA ($6.24), the DOT/USDT pair may slump to the strong support at $5.70.

On the contrary, if the price turns up from the 20-day EMA, it will suggest that traders are buying the minor dips. The bulls will then again try to thrust the price above the downtrend line. If they manage to do that, the pair is likely to pick up momentum and soar toward the neckline of the H&S pattern.

Litecoin price analysis

Buyers pushed Litecoin (LTC) above the overhead resistance of $96 on April 11 but they could not sustain the higher levels, as seen from the long wick on the day’s candlestick.

LTC/USDT daily chart. Source: TradingView

The bears have used the opportunity to pull the price back to the 20-day EMA ($90). This is an important level to watch for because a break and close below it could sink the LTC/USDT pair to the support at $85. A bounce off this level may keep the pair stuck inside the $96-to-$85 range for a few days.

If bulls want to retain their edge, they will have to drive the price above $96. That will open the doors for a possible up-move to $106. On the other hand, a break below $85 could tug the pair to $75.

The views, thoughts and opinions expressed here are the authors’ alone and do not necessarily reflect or represent the views and opinions of Cointelegraph.

This article does not contain investment advice or recommendations. Every investment and trading move involves risk, and readers should conduct their own research when making a decision.

Euler Finance opens redemptions after hacker returns funds

The Ethereum lending protocol was exploited in a $197 million flash loan attack in March.

On April 12, Ethereum-based noncustodial lending protocol Euler Finance announced that it would open redemptions after hackers returned the vast majority of assets stolen in a $197 million flash loan exploit last month. 

Euler says it will repay all sub-account liabilities at the block the protocol was disabled on March 13. The on-chain price oracle, provided by either Uniswap or Chainlink, will determine the Ether (ETH) value of assets and liabilities. The company explained:

“Markets that have bad debt in excess of reserves (a few long-tail markets that suffered oracle attacks) will have the bad debt proportionally distributed amongst depositors in the market.”

Euler has created a smart contract containing funds for all exploited addresses, with an embedded Merkle tree. In order for redemptions to be processed, users’ addresses need to pass the Merkle proof of validity and “an acceptance token that is individually computed for each account, and confirms that the account holder agrees with the terms and conditions.”

Magazine: Should crypto projects ever negotiate with hackers? Probably

On April 4, the Euler Finance hacker returned nearly all recoverable funds following an ultimatum from project developers to either return 90% of stolen assets or face legal action. Following a brief lapse in communication, Euler launched a $1 million bounty for information leading to the whereabouts of the stolen funds and the hacker’s identity, which prompted the latter to return assets. In addition, a user convinced the hacker that he had lost his life savings due to the exploit, which prompted the hacker to return 100 ETH to the individual, who subsequently donated 12 ETH to the Euler treasury.

A total of 95,556 ETH and 43 million DAI (DAI) have been recovered, with the amount being higher than the initial exploited total due to the rising price action of Ether within the past month. Additionally, 1,100 ETH was labeled irrecoverable after the hacker sent the coins to cryptocurrency mixer Tornado Cash.

Related: Euler Finance attack: How it happened, and what can be learned

Ethereum price retests key support level that preceded 60% gains in June 2022

Ether funds have witnessed inflows worth only $600,000 in the week ending April 7 compared to Bitcoin’s $56 million.

Ethereum’s Ether (ETH) token continued its losing streak versus Bitcoin (BTC) for the fifth day in a row as BTC’s price jumped above $30,000 for the first time since June 2022.

ETH/BTC bullish reversal fails midway

On April 11, the ETH/BTC pair dropped nearly 1.6% to 0.0634 BTC to retest multi-month lows.

ETH/BTC daily price chart. Source: TradingView

The ETH/BTC level is down 6.75% from its local peak of 0.0679 BTC set six days ago. It is also just 2% above the pair’s local low of 0.0622 BTC from March 20, showing that Ether’s bullish reversal attempt versus Bitcoin is near failure.

Interestingly, institutional interest also appears to gravitate more toward Bitcoin than Ethereum, according to CoinShares’ weekly report. It shows that the Bitcoin-focused investment funds witnessed inflows worth $56 million in the week ending April 7.

Net flows into crypto funds in the week ending April 7. Source: CoinShares

In comparison, the Ethereum-based funds received only $600,000 despite the hype around its long-awaited Shanghai hard fork on April 12.

Another ETH price rebound attempt ahead?

ETH/BTC’s ongoing decline has prompted it to retest its multi-month ascending trendline support (buy zone) near 0.0635 BTC for a potential price rebound toward its descending trendline resistance (sell zone) near 0.0750 BTC.

In other words, it will have been a 16.5% price rally by June, as covered in previous analysis.

ETH/BTC three-day price chart. Source: TradingView

The bullish reversal outlook takes cues from ETH/BTC’s price rebound in July 2022 after testing the same ascending trendline as support. Notably, the pair rose by about 60% to reach the descending trendline resistance near 0.0856 BTC.

Related: 3 reasons why Ethereum price can reach $3K in Q2

Conversely, a decisive break below the ascending trendline support would raise ETH/BTC’s possibility to eye its 200-week exponential moving average (200-week EMA; the blue wave) near 0.0563 BTC, down about 10% from current price levels.

ETH/BTC weekly price chart. Source: TradingView

Like the ascending trendline support, the 200-week EMA was instrumental in stopping Ether’s price decline versus Bitcoin in July 2022. This makes it the most probable downside target in the coming months.

Magazine: ‘Account abstraction’ supercharges Ethereum wallets: Dummies guide

This article does not contain investment advice or recommendations. Every investment and trading move involves risk, and readers should conduct their own research when making a decision.

Price analysis 4/10: SPX, DXY, BTC, ETH, BNB, XRP, ADA, MATIC, DOGE, SOL

After days of consolidation near the local high, Bitcoin is trying to breakout and challenge the $30,000 level.

Bitcoin’s (BTC) tight consolidation near its local top suggests that traders are waiting for a catalyst to start the next trending move. The Consumer Price Index data on April 12 and the producer price index data on April 13 could give insight into the Federal Reserve’s future rate hikes and shake the traders out of their slumber.

The dull price action in Bitcoin has not reduced the interest in it. According to Ahrefs search volume data, Bitcoin remains the most Googled term in the United States, followed by the keywords “Donald Trump” and “breaking news.”

Daily cryptocurrency market performance. Source: Coin360

Another point worth noting is that Bitcoin’s circulating supply continues to dwindle. Citing Glassnode data, investor Anthony Pompliano pointed out that 53% of Bitcoin’s circulating supply has not moved in the past two years.

If demand increases, there could be a shortage of supply, which could boost prices higher. What are the critical resistance levels to watch for in Bitcoin and altcoins in the near term?

Let’s study the charts to find out.

S&P 500 index price analysis

The S&P 500 index (SPX) turned up after a two-day correction on April 6, indicating that the sentiment remains positive and traders are buying on minor dips.

SPX daily chart. Source: TradingView

The upsloping 20-day exponential moving average (EMA) (4,035) and the relative strength index (RSI) in the positive territory increase the likelihood of a rally to 4,200. Although this level has behaved as a formidable barrier in the past, it is likely to be scaled during the third attempt. If that happens, the index may challenge the 4,300 resistance. This level may witness aggressive selling by the bears.

The first important support to watch on the downside is the 20-day EMA. If this support cracks, the index could retest the vital support at the 200-day simple moving average (SMA) ($3,944).

U.S. Dollar Index price analysis

The U.S. Dollar Index continues to trade below the 20-day EMA (102.73), indicating that the short-term trend remains bearish. Sellers are likely to defend the 20-day EMA during the current relief rally.

DXY daily chart. Source: TradingView

If the price turns down from the 20-day EMA, the index may drop to the vital support of 100.82. The bulls are expected to guard this level with all their might because a break below it will complete a head-and-shoulders (H&S) pattern. The index may then start the next leg of the downtrend.

Another possibility is that the price rebounds off the 100.82 support and rises above the 20-day EMA. If that happens, it will suggest that the index may oscillate between 100.82 and the 200-day SMA (106.47) for some more time.

Bitcoin price analysis

Bitcoin bounced off the 20-day EMA ($27,692) on April 9, indicating buying at lower levels. The gradually upsloping 20-day EMA and the RSI in the positive territory indicate advantage to the buyers.

BTC/USDT daily chart. Source: TradingView

The $29,200 is the key level to watch for on the upside. If bulls pierce this resistance, the BTC/USDT pair may climb to $30,000. The bears will try to stall the rally at this level, but the likelihood of a break above it is high. The pair may then soar to $32,200.

Contrarily, if the price once again turns down from $29,200, it will suggest that bears are active at higher levels. The sellers will then make one more attempt to sink the price below the 20-day EMA. If they succeed, the pair may slump to $25,250.

Ether price analysis

Buyers successfully defended the 20-day EMA ($1,813) on April 9, indicating that the trend remains positive in Ether (ETH).

ETH/USDT daily chart. Source: TradingView

The bulls will try to overcome the barrier at $1,943 and catapult the price to $2,200. Sellers are likely to fiercely defend the zone between $2,000 and $2,200. If the price turns down from this zone but does not break below the 20-day EMA, it will signal that the rally may extend further.

This positive view will invalidate in the near term if the price turns down and plummets below the 20-day EMA. The ETH/USDT pair could then descend to the strong support zone of $1,743 to $1,680.

BNB price analysis

BNB (BNB) has been trading below the 20-day EMA ($313) for the past few days, but the bulls have not allowed the price to slide below the immediate support at $306. This suggests that the selling pressure dries up at lower levels.

BNB/USDT daily chart. Source: TradingView

The bulls will take advantage of the situation and try to drive the price above the overhead resistance of $318. If they do that, the BNB/USDT pair could pick up momentum and soar to $338 and later to $346.

On the contrary, if the price turns down from the current level, it will suggest that the bears are selling on every minor relief rally. If the $306 level gives way, the pair may slip to the 200-day SMA ($292).

XRP price analysis

XRP (XRP) has been trading above the 38.2% Fibonacci retracement level of $0.49 for the past few days, indicating that buyers are not waiting for a deeper correction to buy.

XRP/USDT daily chart. Source: TradingView

The bulls will try to strengthen their position by pushing the price to the overhead zone between $0.56 and $0.58. This remains the key zone to keep an eye on because a break above it could open the doors for a potential rally to $0.65 and thereafter to $0.80.

Instead, if the price turns down and breaks below the 20-day EMA ($0.48), it will suggest that short-term traders may be booking profits. That could tug the XRP/USDT pair to the important support at $0.43.

Cardano price analysis

Cardano’s ADA (ADA) has been trading above the 20-day EMA ($0.37) for the past few days, but the bulls are struggling to clear the neckline of the inverse H&S pattern. This suggests that the bears are defending the level with vigor.

ADA/USDT daily chart. Source: TradingView

Usually, a tight consolidation is followed by a sharp breakout. The rising 20-day EMA and the RSI in the positive area suggest that the breakout may happen to the upside. A close above the neckline will complete the reversal setup and signal the start of a new uptrend toward the target objective of $0.60.

This bullish view will be negated if the price turns down and breaks below the 20-day EMA. The ADA/USDT pair may then tumble to the 200-day SMA ($0.35). This level is likely to attract strong buying by the bulls.

Related: ‘Pop or drop?’ Bitcoin analysts decide if BTC price will beat $30K

Polygon price analysis

Sellers tried to sink Polygon’s MATIC (MATIC) below the support line on April 9 and 10, but the bulls held their ground. This suggests buying at lower levels.

MATIC/USDT daily chart. Source: TradingView

The bulls will try to push the price above the 20-day EMA ($1.11). If they are successful, the MATIC/USDT pair could surge to the resistance line of the symmetrical triangle. A break and close above the triangle will suggest that the bulls have overpowered the bears. That will clear the path for a possible rally to $1.30.

Instead, if the price turns down from the 20-day EMA and plunges below the support line, it will indicate that bears are in control. The pair may then retest the vital support at the 200-day SMA ($0.99).

Dogecoin price analysis

Dogecoin (DOGE) successfully held the moving averages on April 8, but the shallow bounce on April 9 suggests that demand dries up at higher levels.

DOGE/USDT daily chart. Source: TradingView

Both moving averages have flattened out, and the RSI is just above the midpoint, indicating a balance between supply and demand. The bounce off the current level could face selling at the 38.2% Fibonacci retracement level of $0.09. If the price turns down from this level, the DOGE/USDT pair may oscillate between $0.09 and the moving averages for some time.

A break below the moving averages could sink the pair to the strong support of $0.07, while a rise above $0.09 will increase the likelihood of a rally to $0.11.

Solana price analysis

The trading range in Solana’s SOL (SOL) has narrowed down further, indicating uncertainty among the bulls and the bears.

SOL/USDT daily chart. Source: TradingView

The flattish 20-day EMA ($20.64) and the RSI just below the midpoint do not give a clear advantage either to the bulls or the bears. Hence, it is better to wait for a breakout to happen before waging large bets.

If the price turns up and pierces the downtrend line, it may attract strong buying by the bulls. The SOL/USDT pair could then start a rally to $27 and subsequently to $39. On the other hand, the selling could intensify if the price collapses below $18.70. The pair may then nosedive to $15.28.

The views, thoughts and opinions expressed here are the authors’ alone and do not necessarily reflect or represent the views and opinions of Cointelegraph.

This article does not contain investment advice or recommendations. Every investment and trading move involves risk, and readers should conduct their own research when making a decision.

Ethereum staking deposits dip due to regulatory pressure and Shapella upgrade

The amount of ETH being staked monthly has recently dipped according to the on-chain analytics platform Glassnode.

Ethereum staking deposits have declined slightly in recent weeks due to increased regulatory pressure and the Shapella upgrade slated for April 12.

On April 9, on-chain analytics provider Glassnode reported on the current state of the Ethereum staking ecosystem.

The data revealed that deposit activities are currently low, “due to regulatory pressure and the Shanghai upgrade.”

Financial regulators in the United States have been coming down hard on crypto this year. The Securities and Exchange Commission is adamant that Ether (ETH) is a security and has cracked down on staking despite there being no official legislation from Congress classifying ETH as such.

The Ethereum network will undergo a long-awaited upgrade on April 12. The Shapella hard fork, also known as the Shanghai hard fork, will enable the phased release of ETH staked on the Beacon Chain.

These two factors have caused the dip in Ethereum staking deposits, according to Glassnode.

The firm also noted that major centralized exchanges such as Coinbase, Binance and Kraken have lost a lot of market share to the liquid staking platform Lido.

“As the dust settled between the three giants, it was Lido who emerged victorious, continuing to dominate deposit inflows as of present,” it noted.

Lido currently accounts for almost a third of the total amount of ETH staked. This equates to around $11 billion from the 5.9 million ETH on the platform.

Centralized exchanges such as Coinbase take a hefty 25% commission from the staking rewards, with Coinbase’s commissions being even higher for other assets such as Cardano (ADA) and Solana (SOL).

Lido takes a 10% commission and offers the potential of earning additional yields on DeFi platforms through its staking token Lido Staked ETH (stETH). This explains the shift over time as savvy stakers switched to more profitable platforms.

Analysts have predicted that liquid staking platforms such as Lido will get a boost when ETH is released from the Beacon Chain after the Shapella upgrade.

Related: Analysts debate the ETH price outcomes of Ethereum’s upcoming Shapella upgrade

According to the Ethereum metrics tracking platform Ultrasound.Money, there are currently 18.1 million ETH staked in total currently valued at around $33.7 billion and representing 15% of the entire supply.

After the Shapella upgrade, this will be slowly released for withdrawal in the weeks and months that follow.

Magazine: Features ‘Account abstraction’ supercharges Ethereum wallets: Dummies guide