interest rates

Don't get excited about Fed 'dovishness' — another rate hike is in the cards

Contrary to Jerome Powell’s intimations, inflation is likely to rise in the months ahead. If the Fed does not hike rates in 2024, the problem will get worse.

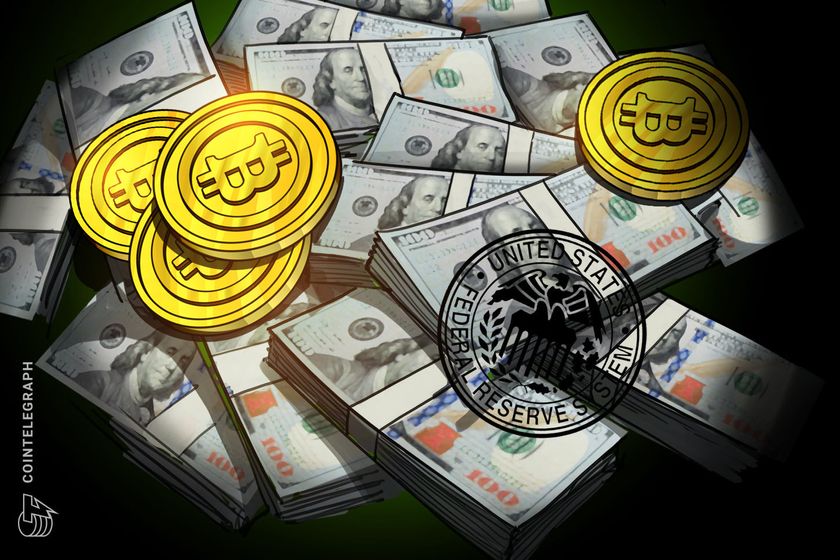
December’s Federal Open Market Committee (FOMC) meeting was a huge boon for markets. Risk assets — including cryptocurrencies — soared as the central bank appeared to take a more dovish stance on monetary policy. But the markets may be in for a nasty surprise in 2024 as the Federal Reserve faces an uphill battle against price increases, which may well force policymakers to hike again to reach their 2% inflation target.

The overwhelming expectation right now is that the Fed has won its battle against inflation. However, this is not what economic analysis shows. In fact, the recent slowdown in price growth is very likely to prove temporary — with inflation soaring again next month to finish the year around 3.5%, and remaining sticky well into 2024. This will be problematic for the central bank, whose dual mandate stipulates it must control prices while maintaining maximum employment.

So far, it has certainly succeeded with the latter. Unemployment remains at historically low levels, dropping from 3.9% in October to 3.7% in November. The economy added 199,000 jobs that month, beating analysts’ expectations. Wage growth also continued to outstrip inflation for the fifth month in a row in October, rising again to 5.7% after a brief hiatus.

Read more

Why is Cardano price down today?

Cardano’s price is down today as traders secure profits at ADA’s overbought levels ahead of a key Federal Reserve rate decision.

Cardano’s (ADA) price is down today, falling 7.75% in the last 24 hours to hit $0.55 on Dec. 13.

Let’s discuss factors that have been driving the Cardano prices lower recently.

From the technical perspective, ADA’s price drop today is part of a correction cycle that started on Oct. 9, when ADA’s price reached its 18-month high of $0.64.

Read more

US Fed 2024 rate cut could prove perfect catalyst for BTC halving

A cut in the U.S. Federal Reserve rate is seen as bullish, as it boosts risk appetite among investors.

Goldman Sachs, the second-largest investment bank in the world, has predicted that the United States Federal Reserve could cut interest rates twice in the next two years, starting as early as the third quarter of 2024. 

Interest rates have a strong correlation to investors’ risk appetite. Goldman Sachs predicted the first Fed rate cut by December 2024, but this forecast has been brought forward to Q3 of 2024 due to cooling inflation, Reuters reported on Dec. 11.

The lender expects the two Fed cuts to bring interest rates to 4.875% by the end of 2024, rather than its previous forecast of 5.13%. 

Read more

Bitcoin price rallies to $29.4K as traders gear up for this week’s CPI print

BTC’s rally to $29,400 comes as the all important CPI report releases on April 12 and traders debate whether the Federal Reserve will pivot.

Bitcoin (BTC) rose to its highest level in ten months on April 10 as traders await this week’s April 12 Consumer Price Index report to gain deeper insight into the Federal Reserve’s fight against sticky inflation. If the report shows inflation dropping, it could be the next possible catalyst that furthers BTC’s upward move. 

On April 10, BTC price soared 3.37% to over $29,300 after a quiet Easter weekend. Interestingly, Bitcoin’s intraday gains appeared alongside a drop in U.S. equities, a rare decoupling that highlights the coin’s diminishing risk-on characteristics.

BTC/USD year-to-date returns versus U.S. stock indexes. Source: TradingView

The pre-CPI dynamic could be in effect

The Bureau of Labor Statistics will release March Consumer Price Index (CPI) data on April 12, which is expected to show inflation down to 5.1% from 6.0% year-over-year previously.

A slowdown in headline CPI increases the prospects of the Federal Reserve shifting in a more dovish direction. Conversely, persistent inflationary forces could lead traders to bet on more interest rate hikes in May.

Bitcoin’s rise above $29,000 suggest that crypto traders have been pricing in a drop in inflation, which, in turn, could lead to a potential Fed pivot.

Nonetheless, the U.S. Dollar Index (DXY), which tracks the greenback’s strength against a basket of top foreign currencies, climbed 0.7% on April 10, which, alongside a weaker U.S. stock market, shows macro investors see a rate hike ahead.

DXY daily price chart. Source: TradingView

In fact, the market sees a 70% probability of the Fed lifting rates by 25 basis points at its meeting in May, according to the CME Fed Watch Tool. That could be due to a tightening labor market that gives the Fed more ammunition to continue raising lending rates in the future.

Could Bitcoin hit $30,000 in April?

From a fundamental perspective, Bitcoin looks prepared to hit $30,000 ahead of the Fed FOMC. However, its likelihood of holding those gains will depend on the inflation data, as mentioned above.

Related: CPI to spark dollar ‘massacre’ — 5 things to know in Bitcoin this week

Meanwhile, from a technical analysis standpoint, Bitcoin must close above its weekly resistance range — defined by the $29,500 to $32,000 area — to eye a run-up toward $40,000.

BTC/USD weekly price chart. Source: TradingView

This range served as support in the December 2020 to February 2021, May 2021 to July 2021 and January 2022 to March 2022 sessions.

In the event of a pullback from the mentioned range, BTC price risks a sharp decline toward its 50-week exponential moving average (50-week EMA; the red wave) near $25,250 and its 200-week exponential moving average (200-week EMA; the blue wave) near $25,000.

The views, thoughts and opinions expressed here are the authors’ alone and do not necessarily reflect or represent the views and opinions of Cointelegraph.

This article does not contain investment advice or recommendations. Every investment and trading move involves risk, and readers should conduct their own research when making a decision.

Will BTC ditch the bear market? 5 things to know in Bitcoin this week

Bitcoin price is gearing up for a key monthly close that could see it dump its 2022 bear market for good.

Bitcoin (BTC) enters the last week of March in uncertain territory as a strong weekly close still keeps $30,000 out of reach.

The largest cryptocurrency has sealed seven days of practically flat performance despite some volatility in between as the market seeks fresh direction. Where could it go next?

In what was a week of more surprises from the macroeconomy, BTC/USD spent much time reacting to decisions from the United States Federal Reserve and associated commentary.

Next up, however, is a period of relative calm, followed by a key monthly close, which analysis says could see the start of a new bullish trend.

Bitcoin is currently up 20% for March, meaning that the coming days will decide the strength of the ongoing recovery from multi-year lows.

Cointelegraph takes a look at five key topics to bear in mind during the final week of what has been a volatile month.

Countdown to Bitcoin price monthly close

Bitcoin managed to close the week with a modest flourish, returning to the $28,000 mark, data from Cointelegraph Markets Pro and TradingView shows.

BTC/USD 1-week candle chart (Binance). Source: TradingView

This meant that BTC/USD stayed practically unmoved versus the weekend prior, delivering some impressive stability despite the periods of volatility which occurred in the intervening period.

Nonetheless, concerns are brewing that the market may struggle to preserve current levels.

In a fresh analysis on March 27, popular Twitter account IncomeSharks flagged on-balance volume (OBV) as a telltale sign of decreasing momentum.

“Just hard to ignore the weak OBV at resistance, price at resistance, and the lack of demand at these prices,” it commented alongside a chart.

“If we drop we get a new wave of buying demand that should push us higher. Only way we go up from here is big news in the markets or another squeeze.”

BTC/USD annotated chart. Source: IncomeSharks/ Twitter

Trader and analyst Rekt Capital agreed that a retracement would be “healthy” for Bitcoin should it enter.

“If BTC continues to struggle to break beyond $28,700 then a healthy dip may need to occur to gain fresh buyer interest at lower levels,” he tweeted on the day.

“Technicals are showing some short-term weakness & it could be that a catalyst will soon appear to play that weakness out.”

Over the weekend, Rekt Capital had flagged that price point as a critical area to watch while remaining upbeat about the longer-term trend.

BTC/USD, he forecast, will “confirm” a breakout from its bear market at the end of March, provided the monthly close preserves the 200-week moving average (WMA) as support.

The 200WMA currently stands at around $25,500, giving bulls room for a modest dip.

Similarly level-headed, but on shorter timeframes, is trader Crypto Tony, who eyed $27,700 and $26,600 to hold on the day.

“We have yet to lose the EQ at $27,700 on a 4 hour time frame, so the doomsday tweets can take a break,” he summarized, referring to the point in a range where buy and sell pressure is balanced.

“The range low at $26,600 is what we need to lose to begin a short hedge position for myself.”

BTC/USD annotated chart. Source: Crypto Tony/ Twitter

PCE data in focus as SVB gets bought out

Unlike last week, the final days of March are not slated to deliver surprises from the U.S. macroeconomic realm.

That is not to say that a curveball will not appear, but the rest of the month is comparatively quiet in terms of macro data releases.

The one key exception could be the March 31 release of the Personal Consumption Expenditures Index (PCE), which holds crucial insights into U.S. inflation trends.

“US PCE inflation numbers are due this week – last month this data caused a volatile move lower in risk,” markets commentator Tedtalksmacro commented.

“However, this month core PCE is expected to cool to +4.4% YoY down from +4.7% previous. That would be risk positive.”

Should Bitcoin react to PCE data that comes in outside expectations, the results could make for a volatile weekend just a day before the monthly close.

Any new developments in the ongoing banking crisis would add uncertainty into the mix, and the risk is there — contagion remains in Europe, while the defunct Silicon Valley Bank (SVB) found a buyer overnight.

Having hiked interest rates despite the crisis, the Fed is on a diverging path when it comes to interest rates, and further hikes could come, it says. In contrast, markets hold the opposite opinion due to the stress already induced by prior rate increases.

“Much tighter financial conditions and ongoing signs of bank stress are major reasons why the market thinks the Fed will be forced to abandon their plans,” analysis platform Mosaic Asset explained in the latest edition of its updates series, “The Market Mosaic,” on March 26.

Related: Crypto winter can take a toll on hodlers’ mental health

Mosaic further warned that historically, risk assets performed worse immediately following news of a rate hike policy pivot.

“If the Fed does pause the rate hiking campaign, it will signal growing concerns that the central bank is breaking something in the capital markets. But also consider that the Fed has a track record of adjusting policy only when it’s too late,” it continued.

It added that “as a result, in past bear markets the steepest stock market declines happened after the Fed pivots to a pause or outright rate cuts.”

BTC hodlers setting up supply shock

Bitcoin hodlers are setting new records under current conditions and laying the foundations for a supply shock in the process.

The latest data from on-chain analytics firm Glassnode shows that the amount of the available BTC supply, which has not left its wallet in two years or longer, is now at all-time highs.

As of March 27, more than 52.5% of all mined BTC has stayed dormant since at least March 2021, with owners not selling or transferring during the ensuing bear market.

Bitcoin dormant 2+ years chart. Source: Glassnode/ Twitter

Address numbers are also in “up only mode,” with the number of wallets holding 0.1 BTC or more setting new records on the day.

Likewise, wallets with a non-zero balance are more plentiful than ever, with 45,388,865 in existence as of March 27.

Bitcoin non-zero balance wallet chart. Source: Glassnode/ Twitter

The numbers feed into an existing narrative over what will happen to BTC price action during the next wave of mainstream consumer interest.

With so much of the supply now ferreted away into cold storage, any rush for BTC could spark the realization that one of the world’s hardest assets is already too scarce.

According to Glassnode, the overall BTC balance held by major exchanges remains near its lowest in five years.

Exchange BTC balance chart. Source: Glassnode

Bitcoin delivers perfect timing

For some, BTC price action is right on track for repeating past cycles, setting a new all-time high in the process.

Among them is Tedtalksmacro, who notes that the timing of the November multi-year lows on BTC/USD was more or less perfect.

Since then, a rally that began in January has stuck, and there have been no signs yet that fresh macro lows will appear to take out the $15,600 floor from November 2022.

“~390 days until the next BTC halving,” Tedtalksmacro wrote on March 27, referencing a dedicated thread about Bitcoin’s performance from the end of January.

BTC price is thus sticking to historical precedent by bottoming more than 400 days before its next block subsidy halving.

Tedtalksmacro, meanwhile, is not the only popular commentator taking halving cycle timing into account when it comes to price.

Earlier this month, Rekt Capital estimated that the next all-time high should be in around 18 months.

“It takes BTC around 900 days to rally from Downtrend breakout to Bull Market top,” he explained.

“If history repeats, $BTC will perform a Bull Market top in the Summer of 2025.”

BTC/USD annotated chart. Source: Rekt Capital/ Twitter

Crypto market sentiment stays greedy

As with last week, a potential thorn remains in the side of Bitcoin’s bull run, which comes from investors themselves.

Related: XRP, LTC, XMR and AVAX show bullish signs as Bitcoin battles to hold $28K

Despite the volatility over the Fed rate hike and inability to push closer to $30,000, Bitcoin has seen the kind of sentiment absent since its late 2021 all-time highs.

According to the Crypto Fear & Greed Index, “greed” presently characterizes market sentiment in crypto more broadly.

On March 21, the Index’s score hit 68/100, the most since November 2021, and has continued to circle the mid-60s since.

While not near “extreme” levels, the higher the Index rises into greed, the more likely a market correction will occur.

Crypto Fear & Greed Index (screenshot). Source: Alternative.me

The views, thoughts and opinions expressed here are the authors’ alone and do not necessarily reflect or represent the views and opinions of Cointelegraph.

Bitcoin price whipsaws as Fed says rate hikes may not be ‘appropriate’

Bitcoin sees swift fluctuations after the Fed hikes 0.25%, but Chair Jerome Powell hints that policy may now change.

Bitcoin (BTC) saw heavy volatility on March 22 as the United States Federal Reserve hinted that it might stop interest rate hikes.

BTC/USD 1-hour candle chart (Bitstamp). Source: TradingView

Powell on rates: “‘May’ and ‘some’ instead of ‘ongoing’”

Data from Cointelegraph Markets Pro and TradingView showed sharp moves both up and down for BTC/USD as the Fed hiked by an anticipated 25 basis points.

During a press conference, Fed Chair Jerome Powell appeared to play down the ongoing U.S. banking crisis and its aftermath while hinting that the day’s interest rate hike may be the last.

In prepared remarks, Powell said that the Fed believes that “events in the banking system over the past two weeks are likely to result in tighter credit conditions for households and businesses, which would in turn affect economic outcomes.”

“It is too soon to determine the extent of these effects, and therefore too soon to tell how monetary policy should respond,” he stated.

“As a result, we no longer state that we anticipate that ongoing rate increases will be appropriate to quell inflation. Instead, we now anticipate that some additional policy firming may be appropriate.”

BTC/USD initially saw local lows of $27,867 on Bitstamp around the events before returning to trade above $28,000, only to continue falling at the time of writing as markets continued to digest Powell’s responses to press inqueries.

On rate hikes specifically, he said that the terms “may” and “some” as opposed to “ongoing” would be best to describe future policy.

Reacting, some commentators nonetheless described Powell’s Fed as “hawkish” in prioritizing inflation above the banking crisis by continuing hiking.

“The Fed have shown thus far, that they are committed to rates higher for longer + inflation as enemy #1,” Tedtalksmacro wrote in part of Twitter follow-up.

BTC price comes full circle

Bitcoin, thus, did not deliver the trip to $30,000 some had hoped for in the run-up to the rate hike decision.

Related: Will the Fed stop rate hikes? 5 things to know in Bitcoin this week

“Shorts liquidated then longs liquidated. Back to the same price we were an hour ago,” analyst Matthew Hyland summarized.

Data from monitoring resource Coinglass put the total crypto liquidations for the day at $36 million and $78 million for shorts and longs, respectively.

Crypto liquidations chart. Source: Coinglass

The views, thoughts and opinions expressed here are the authors’ alone and do not necessarily reflect or represent the views and opinions of Cointelegraph.

Bitcoin $30K bets greet FOMC as analyst warns over long liquidations

Bitcoin may celebrate no matter what the Fed decides on interest rates, but one analyst worries about the extent of longs that would be liquidated below $20,000.

Bitcoin (BTC) may “take out shorts” to crack $30,000 during the day’s key United States macroeconomic policy updates, analysis says.

As bets pile up over how BTC’s price will react to the Federal Reserve’s decision on interest rates, $30,000 is in sight — but a drop to below $20,000 is not off the table.

Trader plans $30,000 profit-taking

Bitcoin is hours away from what popular trader Crypto Tony calls “one of the most anticipated” Fed meetings ever.

The Federal Open Market Committee (FOMC) will decide how to tweak baseline interest rates on March 22, amid suspicions that the ongoing U.S. banking crisis has disrupted policy.

From ongoing rate hikes forecast just last month, markets are now considering the chances that the Fed will pause the cycle, data from CME Group’s FedWatch Tool shows.

Fed target rate probabilities chart. Source: CME Group

This would be a key boon for risk assets, as the Fed would be tacitly implying that the eighteen months it has spent removing liquidity from the economy has not been the silver bullet to recovery.

Liquidity is already on the up thanks to the failure of several banks, Cointelegraph reported, with a chunk of the quantitative tightening (QT) removals undone in a single week.

“So FOMC today which means one thing, VOLATALITY. No doubt we will trend sideways util the meeting, which means tread cautiously,” Crypto Tony told Twitter followers in comments on the day.

“My main play is to take profit at $30,000 if it comes.”

BTC/USD annotated chart. Source: Crypto Tony/Twitter

Markets commentator Tedtalksmacro meanwhile laid out the probabilities of each Fed path and the likely impact on risk assets.

“Slow grind upwards on Bitcoin, which means that my eyes are still focused on $28,700,” Cointelegraph contributor Michaël van de Poppe, founder and CEO of trading firm Eight, continued.

“I’m expecting us to sweep into that high around FOMC and then we’ll have some consolidation. CME gap at $28,700 too.”

BTC/USD annotated chart. Source: Michaël van de Poppe/Twitter

Van de Poppe referred to a so-called “gap” in CME Group’s Bitcoin futures markets formed when the price began a new trading week in a different position than it finished the week prior. Historically, the spot price has gone up or down to “fill” such gaps.

The gap in focus was created in June 2022, data from TradingView confirms.

CME Group Bitcoin futures 1-day candle chart. Source: TradingView

“Do you really want to get bullish?”

Adopting a more conservative view, however, popular analyst Justin Bennett warned that the current spot price trading range represents significant historical resistance.

Related: Bitcoin hits new 9-month highs above $28K as markets flipflop over FOMC

A “squeeze” of shorts could result in $30,000 appearing, he acknowledged, but a sudden dive could have the opposite effect, with longs betting that $20,000, at least, will hold.

“Look, maybe we see BTC take out short liquidations up to $30k,” Bennett summarized.

“But do you really want to get bullish at macro resistance with a massive block of long liquidations sub $20k? I don’t.”

An accompanying chart showed the extent of liquidations triggered by such a move below the $20,000 mark.

Bitcoin liquidation levels annotated chart. Source: Justin Bennett/ Twitter

The views, thoughts and opinions expressed here are the authors’ alone and do not necessarily reflect or represent the views and opinions of Cointelegraph.

Bitcoin price nears $25K as analysts place bets on CPI impact

Bitcoin lines up a fresh charge at multimonth resistance, but BTC price action already faces calls for a comedown triggered by CPI.

Bitcoin (BTC) eyed key resistance near $25,000 on March 14 as markets awaited key economic data from the United States.

BTC/USD 1-day candle chart (Bitstamp). Source: TradingView

Hopes CPI will bring Bitcoin “consolidation”

Data from Cointelegraph Markets Pro and TradingView showed BTC/USD making monthly highs of $24,917 on Bitstamp overnight.

The pair remained buoyant after the impact of multiple U.S. bank closures sent crypto markets skyrocketing.

Now, all eyes were temporarily on the Consumer Price Index (CPI) print for February when it came to short-term BTC price action.

A classic crypto volatility catalyst in itself, last month, CPI showed an unwelcome slowdown in inflation abating; this, in turn, gave rise to fears that the Federal Reserve would keep interest rates higher for longer.

However, risk assets had little time to worry as the banking crisis overshadowed the inflation debate. On the day, expectations already pointed to the Fed abandoning rate hikes altogether — regardless of CPI trends.

“Bitcoin sweeping the highs here as it’s testing range high at $25K,” Cointelegraph contributor Michaël van de Poppe, founder and CEO of trading firm Eight, told Twitter followers.

“You’d preferably want to see some period of consolidation (CPI day today) before continuation. If markets sweep range high at $25.2K, make a bear. div and fall back, I’d be looking for shorts to $23K.”

BTC/USD annotated chart. Source: Michaël van de Poppe/ Twitter

On-chain monitoring resource Material Indicators pointed to a potential shake-up in order book composition thanks to CPI.

Should the data outpace expectations, bid support could “rug,” it warned, opening up the path for a deeper BTC price correction.

“Asia may continue to eat ask liquidity and clear a path for volatility before the CPI Report,” it commented about moves on the BTC/USD pair on Binance.

“If CPI is hot, I expect support to rug. If it’s cold, and another bank doesn’t go under before lunch, a bigger short squeeze.”

An accompanying chart from co-founder Keith Alan showed $23,600 and $25,000 as the principal areas of bid and ask liquidity, respectively.

BTC/USD order book data (Binance). Source: Keith Alan/ Twitter

Material Indicators added that in order for Bitcoin’s overall rally to have legs, it would need to deliver multiple weekly closes above its 200-week moving average (WMA).

“Need full candles above the 200 WMA to consider a breakout,” it confirmed.

BTC/USD 1-week candle chart (Bitstamp) with 200MA. Source: TradingView

CPI: “Manufactured” or “in some solid shape”?

Lower-than-expected CPI readings would boost the case for the Fed to lay off further rate hikes and loosen financial conditions.

Related: Fed starts ‘stealth QE’ — 5 things to know in Bitcoin this week

For his part, U.S. President Joe Biden last week appeared to have no concerns that inflation was on the right track, even before the banking crisis fully erupted.

In a White House press conference, Biden said he was “optimistic we’re going to get the — the CPI next week. Hopefully, we’ll be in — in some solid shape.“

Among analysts, however, there were suspicions. A surprise drop in CPI would be most beneficial for a Fed currently backed into a corner by recent events, popular trader xTrends implied.

“I believe tomorrows CPI will be manufactured to prevent a market crash, and it will be silently revised weeks later like they did with the last few CPI numbers,” he revealed in part of the Twitter commentary.

A starker warning on macro came from Cathie Wood, CEO of ARK Invest, who issued a grim forecast for the consequences of any further rate hikes.

In a dedicated Twitter thread on March 13, Wood, under whose leadership ARK continues to increase crypto exposure, called for a Fed “pivot” on rates.

“If the Fed continues to focus on lagging indicators like the CPI, and does not pivot in response to the deflationary forces telegraphed by the inverted yield curve, then this crisis will devour more regional banks and further centralize, if not nationalize, the US banking system,” she wrote.

The views, thoughts and opinions expressed here are the authors’ alone and do not necessarily reflect or represent the views and opinions of Cointelegraph.

Monetary policy: Definition, types and tools

Monetary policy refers to the actions taken by a central bank to manage the money supply and interest rates in an economy.

What is monetary policy?

Monetary policy refers to the actions taken by a central bank or monetary authority to manage the supply of money and interest rates in an economy, with the aim of promoting economic growth and stability. To affect the price and accessibility of credit, this may entail altering the money supply, setting interest rates or utilizing other instruments. 

The ultimate goal of monetary policy is to achieve and maintain a healthy economy. This usually involves balancing multiple objectives, such as:

To ensure economic stability, lessen the effects of economic shocks and promote sustainable economic growth, central banks carefully control the money supply and interest rates. However, depending on the unique circumstances and requirements of each economy, monetary policy’s exact goals and tactics may change.

Types of monetary policy

There are two main types of monetary policy:

  • Expansionary monetary policy: The goal of an expansionary monetary policy is to boost the money supply and promote economic expansion. Lowering interest rates, expanding the money supply and easing reserve requirements can all be used to achieve this.
  • Contractionary monetary policy: It aims to decrease the money supply and control inflation. Raising interest rates, reducing the money supply and boosting reserve requirements can all be used to achieve this.

Different types of monetary policy tools

The tools used to implement monetary policy can be broadly categorized into three types:

  • Open market operations: This involves the central bank buying or selling government securities in the open market to increase or decrease the money supply.
  • Interest rates: The central bank can change the benchmark interest rate, which is the rate at which banks can borrow from the central bank. This influences other interest rates in the economy, affecting borrowing and spending.
  • Reserve requirements: The central bank can change the reserve requirements for banks, which affects the amount of funds banks must hold in reserve and can lend out.

Other tools used less frequently include discount window lending, moral suasion and direct controls on bank lending.

Monetary policy of fiat currency vs. monetary policy of cryptocurrencies

To achieve macroeconomic goals such as price stability, full employment and economic growth, central banks like the Federal Reserve in the United States set and implement monetary policy for fiat currencies. To affect the money supply and demand in the economy, central banks employ a variety of monetary policy measures, including changing interest rates, conducting open market transactions and imposing reserve requirements.

Related: Crypto resonates better with BIS’ vision of ideal monetary system

On the other hand, cryptocurrencies like Bitcoin (BTC) use a decentralized monetary policy, which refers to the approach of controlling the supply of money in a cryptocurrency that is based on decentralized, algorithmic rules, rather than centralized decision-making by a central authority or central bank.

In a decentralized monetary system, mathematical algorithms stored in the cryptocurrency’s software control the creation and circulation of money. This ensures that the money supply remains stable and is not subject to arbitrary changes by a central authority. For instance, Bitcoin is restricted to 21 million, and its creation rate gradually decreases over time.

There are a number of benefits to decentralizing monetary policy as opposed to centralization. By establishing a more stable and predictable monetary policy, it removes the need for faith in a centralized authority and lowers the risk of inflation. Furthermore, it makes it more challenging for governments to manipulate the money supply for purposes of politics or commerce.

Related: What is the economic impact of cryptocurrencies?

However, decentralized monetary policies also have their challenges. They may not be able to react to changes in market conditions rapidly because they are less flexible than centralized monetary policy. Additionally, deflationary pressure from the scarcity of various cryptocurrencies may prevent people from investing and spending money.

What will the monetary policy of CBDCs look like?

Since central banks will be able to modify the quantity of central bank digital currencies (CBDCs) to meet their macroeconomic goals, similar to conventional fiat currencies, CBDCs issued by central banks may provide greater control over the money supply and demand than cryptocurrencies. This indicates that central banks may affect the amount of money in circulation and the demand for it in the economy by altering interest rates, conducting open market transactions and imposing reserve requirements.

Related: Wholesale CBDC vs. retail CBDC: Key differences

However, the precise monetary policy of CBDCs would depend on their individual designs and the goals of the central banks issuing them. The monetary policies of some CBDCs may be more open-ended, whereas those of others may be more closely aligned with existing fiat currencies or cryptocurrencies. The developing nature of digital currencies and the requirement for central banks to adopt this new technology will likely ultimately impact the monetary policy of CBDCs.

Here’s why Bitcoin price could correct after the US government resolves the debt limit impasse

Bitcoin price has been on a tear, but analysts warn that resolving the U.S debt limit issue could trigger sharp downside for risk assets like BTC.

For much of 2022, the crypto market focused on the United States Federal Reserve’s actions. The central bank created a bearish environment for risk-on assets like stocks and cryptocurrencies by increasing the interest rates on borrowing. 

Toward the end of 2022, positive economic data, healthy employment numbers and a decreasing inflation rate provided hope that a much-awaited slowdown in the rate of interest rate hikes would occur. Currently, the market expects that rate hikes will reduce from 50 basis points (bps) to 25 bps before the complete end of the hiking regime by mid-2023.

From the perspective of the Fed’s goal of constraining liquidity and providing headwinds to an overheated economy and stock market, things are starting to improve. It appears that the Fed’s plan of a soft-landing by quantitative tightening to curb inflation without throwing the economy into a deep recession might be working. The recent rally in stock markets and Bitcoin can be attributed to the market’s trust in the above narrative.

However, another essential American agency, the U.S. Treasury, poses significant risks to the global economy. While the Fed has been draining liquidity from the markets, the Treasury provided a countermeasure by draining its cash balance and negating some of the Fed’s efforts. This situation may be coming to an end.

It invokes risks of constrained liquidity conditions with the possibility of an adverse economic shock. For this reason, analysts warn that the second half of 2023 may see excess volatility.

Backdoor liquidity injections negate the Fed’s quantitative tightening

The Fed started its quantitative tightening in April by increasing the interest rates on its borrowings. The aim was to reduce inflation by constraining the market’s liquidity. Its balance sheet shrank by $476 billion during this period, which is a positive sign considering that inflation dropped and employment levels stayed healthy.

U.S. Fed Balance sheet. Source: U.S. Federal Reserve

However, during the same time, the U.S. Treasury used its Treasury General Account (TGA) to inject liquidity into the market. Typically, the Treasury would sell bonds to raise additional cash to meet its obligations. However, since the nation’s debt was close to its debt ceiling level, the federal department used its cash to fund the deficit.

U.S. Treasury General Account Balance. Source: MacroMicro

Effectively, it’s a backdoor liquidity injection. The TGA is a net liability of the Fed’s balance sheet. The Treasury had drained $542 million from its TGA account since April 2022, when the Fed began rate hikes. Independent macro market analyst Lyn Alden told Cointelegraph:

“U.S. Treasury is drawing down its cash balance to avoid going over the debt ceiling, which is adding liquidity into the system. So, the Treasury has been offsetting some of the QT that the Fed is doing. Once the debt ceiling issue gets resolved, the Treasury will be refilling its cash account, which pulls liquidity out of the system.”

Debt ceiling issue and potential economic fallout

The U.S. Treasury’s debt totaled approximately $31.45 trillion as of Jan. 23. The number represents the total outstanding of the U.S. government accumulated over the nation’s history. It is crucial because it has reached the Treasury’s debt ceiling.

The debt ceiling is an arbitrary number set by the U.S. government that limits the amount of Treasury bonds sold to the Federal Reserve. Hitting it means that the government can no longer take on additional debts.

Currently, the U.S. has to pay interest on its national debt of $31.4 trillion and spend on the welfare and development of the country. These expenditures include salaries of public medical practitioners, educational institutions and pension beneficiaries.

Needless to say, the U.S. government spends more than it makes. Thus, if it can’t raise debt, there’ll have to be a cut in either interest rate payments or government expenditures. The first scenario means a default in U.S. government bonds, which opens a big can of worms, starting with a loss of trust in the world’s largest economy. The second scenario poses uncertain but real risks as failure to meet public goods payment can induce political instability in the country.

But, the limit is not set in stone; the U.S. Congress votes on the debt ceiling and has changed it many times. The U.S. Treasury Department notes that “since 1960, Congress has acted 78 separate times to permanently raise, temporarily extend, or revise the definition of the debt limit — 49 times under Republican presidents and 29 times under Democratic presidents.”

If history is any indication, lawmakers are more likely to resolve those issues by raising the debt ceiling before any real damage is done. However, in that case, the Treasury would be inclined to increase its TGA balance again; the department’s target is $700 billion by 2023 end.

Either by draining out its liquidity completely by June or with the help of a debt ceiling amendment, the backdoor liquidity injections into the economy would come to a close. It threatens to create a challenging situation for risk-on assets.

Bitcoin’s correlation with stock markets remains strong

Bitcoin’s correlation with the U.S. stock market indexes, especially the Nasdaq 100, remains near all-time highs. Alden noted that FTX’s collapse suppressed the crypto market in Q4 2022 when the equities rallied on slower rate hike expectations. And while Congress delays its decision on the debt ceiling, favorable liquidity conditions have allowed Bitcoin’s price to rise.

BTC/USD price chart with Bitcoin-Nasdaq correlation coefficient. Source: TradingView

However, the correlation with the stock markets is still strong, and movements in S&P 500 and Nasdaq 100 will likely continue influencing Bitcoin’s price. Nik Bhatia, a financial researcher, wrote about the importance of the stock market’s direction for Bitcoin. He said,

“…in the short term, market prices can be very wrong. But over the more intermediate term, we have to take trends and trend reversals seriously.”

With the risks from the ongoing Fed’s quantitative tightening and stoppage of Treasury liquidity injections, the markets are expected to stay vulnerable through the second half of 2023.

The views, thoughts and opinions expressed here are the authors’ alone and do not necessarily reflect or represent the views and opinions of Cointelegraph.

This article does not contain investment advice or recommendations. Every investment and trading move involves risk, and readers should conduct their own research when making a decision.