Inflation

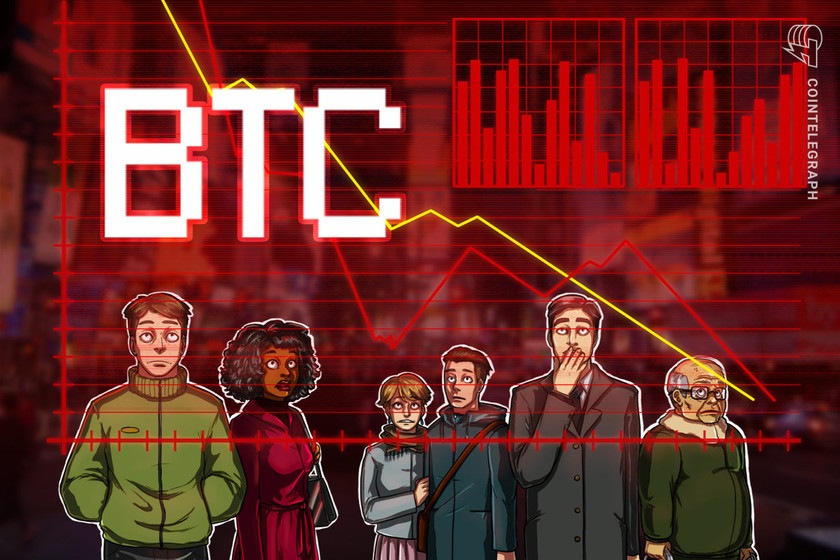
Bitcoin holds $20K as ECB warns inflation may never return to pre-COVID lows

Markets beyond the euro slow to react as Europe acknowledges higher inflation may be permanent.

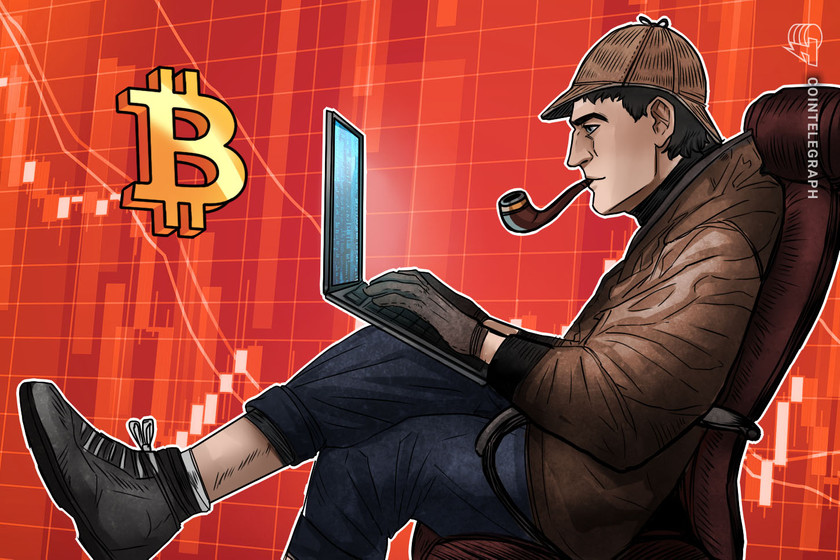
Bitcoin (BTC) held steady at just above $20,000 after the June 29 Wall Street open as Europe’s chief banker admitted the world would “never” return to low inflation.

BTC/USD 1-hour candle chart (Bitstamp). Source: TradingView

Lagarde on inflation: “I don’t think we’re ever going back”

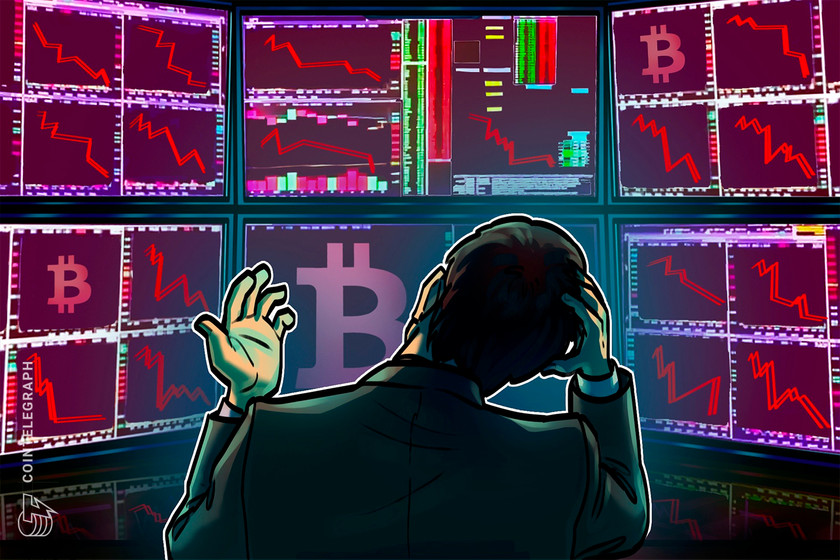
Data from Cointelegraph Markets Pro and TradingView showed BTC/USD looking nonvolatile but precarious as it stuck in a narrow range on the day.

United States equities markets were likewise calm after Asian trading had seen fresh losses. In Europe, meanwhile, comments from central bankers set the macro tone.

In particular, Christine Lagarde, head of the European Central Bank (ECB), appeared to state that inflation would remain high indefinitely.

“I don’t think we’re going back to that period of low inflation,” she said during a press conference at the ongoing ECB Forum event in Sintra, Portugal.

Joining her was Fed Chair, Jerome Powell, who sounded similarly downbeat on the prognosis while promising to not rest until inflation matched the bank’s 2% target.

“That is our aim, that is our intention; we think there are various pathways to achieve that, to achieve the path back to 2% inflation while sustaining a strong labor market. We believe we can do that, that’s our aim; there’s no guarantee that we can do that,” he said.

Bitcoin bulls defend 2017 top

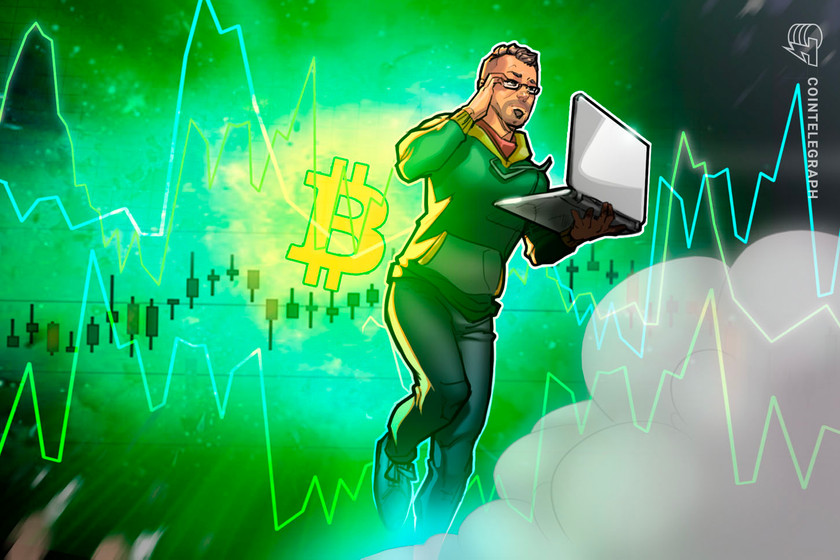
Bitcoin was unresponsive to the comments, which preceded fresh U.S. Consumer Price Index (CPI) data by around two weeks.

For Bitcoin analysts, meanwhile, the focus was on the June monthly close.

On-chain analytics resource Material Indicators eyed a breakout now due “very soon” as the monthly candle was all but doomed to disappoint.

“Bulls are defending the 2017 Top, but with one day to go, it’s going to be almost impossible to print a green Monthly candle,” it told Twitter followers.

“Still a chance for green on the Weekly. Expecting volatility. One way or another, Bitcoin is going to breakout or breakdown very soon.”

An accompanying chart showing the order book of major exchange Binance confirmed the buy and sell interest on BTC/USD focusing right at current prices.

BTC/USD order book data (Binance). Source: Material Indicators/ Twitter

As Cointelegraph reported, June 2022 was already on track to be the worst month since 2018.

Prices continues to roast corporate investors

Elsewhere, MicroStrategy upped its Bitcoin corporate treasury with a fresh 480 BTC purchase, a move lauded by commentators.

Related: No flexing for Bitcoin Cash users as BCH loses 98% against Bitcoin

Smaller compared to some buy-ins, MicroStrategy and CEO Michael Saylor was running conspicuously against claims that the company might be liquidated on a $205 million loan taken out for BTC acquisition.

“Although this recent buy of 480 BTC from Saylor may be relatively small, I think it sends a message more than anything,” William Clemente, lead insights analyst at Blockware, reacted.

“Despite all the criticism and claims he’s “getting liquidated” from bears, he’s not going anywhere and is sticking to his long-term allocation strategy.”

A look at monitoring resource Bitcoin Treasuries nonetheless showed MicroStrategy down a combined $1.4 billion on its inventory, with number two Tesla down almost 50%.

Payment network Square also remained down $60 million on its $220 million allocation.

Major publicly traded companies’ BTC treasury data (screenshot). Source: Bitcoin Treasuries

The views and opinions expressed here are solely those of the author and do not necessarily reflect the views of Cointelegraph.com. Every investment and trading move involves risk, you should conduct your own research when making a decision.

Bitcoin bounces 8% from lows amid warning BTC price bottom ‘shouldn’t be like that’

Hodlers catch their breath as markets digest the prospect of higher Fed rate hikes, but traders refuse to believe that Bitcoin is done dropping.

Bitcoin (BTC) spared hodlers the pain of losing $20,000 on June 15 after BTC/USD came dangerously close to last cycle’s high.

BTC/USD 1-hour candle chart (Bitstamp). Source: TradingView

Bitcoin “bottom” fools nobody

Data from Cointelegraph Markets Pro and TradingView showed BTC/USD surging higher after reaching $20,079 on Bitstamp.

In a pause from its sell-off, the pair followed United States equities higher on the Wall Street open, hitting $21,700. The S&P 500 gained 1.4% after the opening bell, while the Nasdaq Composite Index managed 1.6%.

The renewed market strength, commentators said, was thanks to the majority already pricing in outsized key rate hikes by the Federal Reserve, due to be confirmed on the day.

Nonetheless, it was crypto taking the worst hit in the inflationary environment, Bloomberg chief commodity strategist Mike McGlone noted. In a tweet, he contrasted Bitcoin and altcoin performance with skyrocketing commodities, notably WTI crude oil, futures of which now traded at almost double their 200-week moving average.

“Unprecedented Crude Spike vs. Bottoms in Bitcoin, Bonds, Gold — Crude oil futures’ historically extreme stretch above its 200-week mean is ample fuel for inflation to spike, consumer sentiment to plunge, Federal Reserve rate hikes to accelerate and an enduring hangover,” he argued.

WTI crude oil futures 1-week candle chart with 200-day moving average. Source: TradingView

Despite suppressed price action, many were unconvinced that Bitcoin could meanwhile sustain even the low $20,000 zone much longer.

“We have yet to see capitulation in the Crypto markets,” popular trader Crypto Tony told Twitter followers.

“It is close, but doesn’t feel like it yet. Every bounce is filled with optimism and it shouldn’t be like that.”

Fellow trader and analyst Rekt Capital agreed, saying that the sell-off had not been accompanied by suitable volume.

“Strong market-wide selling is going on for BTC,” he wrote on the day. 

“Undoubtedly, Seller Exhaustion lies ahead. Watch for high sellside volume bars. These tend to signal bottoming out after constant selling & precede an entire trend reversal over time.”

As Cointelegraph reported, Bitcoin’s own 200-week moving average lay at $22,400, Rekt Capital warning that the level could now form a price magnet for weeks or even months.

Losses still do not equal “capitulation” — data

Data meanwhile showed the extent to which panic selling had been taking place in the short term.

Related: Bitcoin miners’ exchange flow reaches 7-month high as BTC price tanks below $21K

Weekly realized losses reached 2.6% of Bitcoin’s realized cap, the highest ever, according to figures from on-chain analytics firm Glassnode illustrated by CryptoVizArt.

Bitcoin’s net unrealized profit/loss (NUPL) metric, covering coins not physically sold, also demonstrated a significant proportion of the hodled supply being underwater — the most, in fact, since March 2020. 

According to its accompanying scale, the metric has turning red after falling below zero, i.e., the historical “capitulation” zone.

Bitcoin NUPL vs. BTC/USD chart. Source: TradingView

The views and opinions expressed here are solely those of the author and do not necessarily reflect the views of Cointelegraph.com. Every investment and trading move involves risk, you should conduct your own research when making a decision.

BTC price crashes to $20.8K as ‘deadly’ candles liquidate $1.2 billion

Carnage for short-term traders and speculators as volatility destroys both long and short positions on the way to $20,000.

Bitcoin (BTC) came within $1,000 of its previous cycle all-time highs on June 14 as liquidations mounted across crypto markets. 

BTC/USD 1-hour candle chart (Bitstamp). Source: TradingView

Bitcoin price hits 18-month lows

Data from Cointelegraph Markets Pro and TradingView showed BTC/USD hitting $20,816, on Bitstamp, its lowest since the week of December 14, 2020.

A sell-off that began before the weekend intensified after the June 13 Wall Street opening bell, with Bitcoin and altcoins falling in step with United States equities.

The S&P 500 finished the day down 3.9%, while the Nasdaq Composite Index shed 4.7% ahead of key comments from the U.S. Federal Reserve on its anti-inflation policy.

The worst of the rout was reserved for crypto, however, and with that, BTC/USD lost 22.4% from the start of the week to the time of writing.

The pair was also “uncomfortably close” to crossing the $20,000 mark, trading firm QCP Capital noted, this representing the all-time high from its previous halving cycle, something which had never happened before.

In a circular to Telegram channel subscribers, QCP flagged both the inflation topic and potential insolvency at fintech protocol Celsius as driving the sell-off.

“We have been expressing concern about the collapse of a significant credit player since the LUNA blowup. The market is now panicking about the impact and contagion if Celsius becomes insolvent,” it explained:

“Some key liquidation levels that the market is looking out for are 1,150 in ETH, 0.8 in stETH/ETH and 20,000 in BTC. We are getting uncomfortably close.”

For other analysts, all bets were off when it came to guessing the BTC price floor or whether key trendlines would hold as support.

Rekt Capital warned that the 200-week simple moving average (SMA) at $22,400 had not been accompanied by significant volume interest, leaving the door open for a test of lower levels.

“BTC has reached the 200-week MA but the volume influx isn’t as strong as in previous Bear Market Bottoms formed at the 200 MA,” he told Twitter followers:

“But downside wicking below the 200 MA occurs & perhaps this wicking needs to occur this time to inspire a strong influx of volume.”

At the time of writing, the 200 SMA appeared to be acting more like resistance than support on low timeframes.

BTC/USD 1-week candle chart (Bitstamp) with 200 SMA. Source: TradingView

Altcoin futures index shows full force of retracement

On altcoins, Ether (ETH) fell to 40% below the previous week’s high to near the $1,000 mark.

Related: Lowest weekly close since December 2020 — 5 things to know in Bitcoin this week

Should that break, it would be the first time that ETH/USD had traded at three-digit prices since January 2021. As Cointelegraph reported, the pair had already crossed its $1,530 peak from Bitcoin’s previous halving cycle.

Across altcoins, there was little cause for celebration in this downtrend, Rekt Capital argued, highlighting flagging alt presence versus Bitcoin.

In a sign of the pain affecting all crypto traders, meanwhile, data from on-chain monitoring resource Coinglass confirmed cross-market liquidations passing $1.2 billion in just 24 hours.

Crypto liquidations chart. Source: Coinglass

The views and opinions expressed here are solely those of the author and do not necessarily reflect the views of Cointelegraph.com. Every investment and trading move involves risk, you should conduct your own research when making a decision.

Lowest weekly close since December 2020 — 5 things to know in Bitcoin this week

Bitcoin sheds 12% in 24 hours as a fresh altcoin meltdown combines with macro pressures to offer nothing but misery for hodlers.

Bitcoin (BTC) begins a new week with a totally different feel to last as BTC/USD seals its lowest weekly close since December 2020.

A night of losses into June 13 means that the largest cryptocurrency is now edging closer to beating its ten-month lows from May.

The weakness has left few guessing: shock inflation data from the United States last week sparked a chain reaction across risk assets and low weekend liquidity appeared to exacerbate the consequences for crypto assets.

The macro pain continues this week. The Federal Reserve is due to provide information on rate hikes and the economy more broadly — the first official policy update since the inflation figures.

The mood among analysts on both Bitcoin and altcoins — while not unanimously bearish — is thus one of resignation. A period of painful trading and hodling conditions may have to be endured before a return to the upside, something which at least chimes with the historical patterns of Bitcoin’s halving cycles.

What could be the market triggers in the coming week? Cointelegraph takes a look at five factors to consider as a Bitcoin trader.

Celsius “collapse” looms, sending Bitcoin tumbling

It was a long time coming, but Bitcoin has finally broken out of the tight range in which it has traded since first dipping to ten-month lows last month.

After bouncing from $23,800, BTC/USD then circled the $30,000 zone for weeks on end, failing to deliver a decisive move up or down. Now, while not what investors would like, the direction seems clear.

It is not just one range that Bitcoin has exited, as trader and analyst Rekt Capital noted on June 12. In abandoning the zone near $30,000, BTC/USD is also ditching a macro trading range in place since the start of 2021.

As such, the most recent weekly close, at around $26,600, was Bitcoin’s lowest since December 2020, data from Cointelegraph Markets Pro and TradingView shows.

“Worst is over. $BTC 25k defended. Think can squeeze a little now, resume selling tomorrow with equities,” economist, trader and entrepreneur Alex Krueger predicted.

An accompanying chart showed a band of buy support in place at $25,000, helping peg 24-hour losses at 12%.

BTC/USD order book data chart (Binance). Source: Alex Krueger/ Twitter

The market at the time of writing was nonetheless in a state of flux as the dust settled on a grim reminder of what happened during May’s spike below $24,000.

Whereas then it was Blockchain protocol Terra’s (LUNA) and TerraUSD (UST) tokens imploding, this weekend, it was the turn of fintech platform Celsius and its CEL token to follow suit.

Down 40% on the day in USD terms, CEL predictably suffered from a decision by Celsius to halt withdrawals and transfers altogether in order to “stabilize liquidity.”

“Due to extreme market conditions, today we are announcing that Celsius is pausing all withdrawals, Swap, and transfers between accounts. We are taking this action today to put Celsius in a better position to honor, over time, its withdrawal obligations,” a blog post issued on June 13 reads.

Reacting, Bitcoin pundits already skeptical of the altcoin space following the Terra debacle wasted no time in pinning the blame for the extent of BTC price losses on events at Celsius.

“Celsius looks like it could collapse and take a bunch of customer money with it,” Robert Breedlove, host of the What is Money podcast, added in part of Twitter comments.

Fed policy update looms on 40-year record inflation

A black swan event copying Terra is arguably the last thing that Bitcoin needs, given the already shaky macro conditions.

Regardless, the scope for fresh turmoil remains this week as the Fed’s Federal Open Markets Committee (FOMC) prepares for its June policy meeting which starts June 15.

Coming after June 10’s 8.6% inflation readout, expectations are that the gathering will hasten the pace of key rate hikes — something which neither stocks nor crypto assets would welcome.

Krueger, like others, added that the Fed would most likely be the clinch factor in determining the remaining downside for risk assets.

“For the bottom have to wait for the Fed (or equities) to turn,” he wrote:

“Can scalps levels, but seriously doubt any level will bring a trend change by itself. Slight chance the Fed does not turn hawkish on Wed and if so rally hard. Hawkish acceleration more likely.”

An Asian sell-off made life worse for equities at the start of the week, impacting risk-sensitive currencies such as the Japanese yen and Australian dollar.

“At some point financial conditions will tighten enough and/or growth will weaken enough such that the Fed can pause from hiking,” Goldman Sachs strategists including Zach Pandl wrote in a note quoted by Bloomberg on June 13:

“But we still seem far from that point, which suggests upside risks to bond yields, ongoing pressure on risky assets, and likely broad US dollar strength for now.”

Bloomberg additionally reported that a 75-basis-point rate hike may be on the table, as markets price in base rates of 3% or more by the end of the year.

U.S. dollar wastes no time challenging 20-year highs

Where risk assets suffer, the United States dollar has made the most of its power over the past two years.

That trend looks set to continue as macro conditions pressure practically every other world currency and risk assets to provide no realistic safe haven.

The U.S. dollar index (DXY), despite retracing in recent weeks, is now firmly back in the saddle and targeting the highs of 105 seen in May. These reflect peak USD strength since 2002 and at the time of writing, are just 0.5 points away.

“$DXY is going strong, no wonder assets are tanking,” Tony Edward, host of the Thinking Crypto Podcast, responded.

Since the cross-market crash of March 2020, DXY strength has been a reliable counter-indicator for BTC price performance. Until a significant trend change enters, the outlook for Bitcoin could thus stay skewed to the sell-side.

“Dollar strength often leads to contractions in corporate earnings globally. Today’s inflation problem adds even further pressure on profit margins to be squeezed,” Otavio Costa, founder of global macro asset management firm Crescat Capital, told Twitter followers about the dollar versus the Fed’s inflation narrative on June 12:

“Only a matter of time before the ‘soft landing’ narrative turns into the same old ‘transitory’ nonsense.”

U.S. dollar index (DXY) 1-day candle chart. Source: TradingView

“Misery Index” underscores market fear

There will be no surprises when it comes to cryptocurrency market sentiment this week, with the macro mood likewise taking a turn for the worse.

The Crypto Fear & Greed Index, which uses a basket of factors to determine overall conditions among traders, is teetering on the edge of a dip into single figures.

Crypto Fear & Greed Index (screenshot). Source: Alternative.me

Having spent much of 2022 in an area traditionally reserved for market bottoms, Fear & Greed has yet to convince anyone that a floor could be in.

On June 13, it measured 11/100, just three points higher than its macro lows from March 2020.

Last week’s inflation print similarly took its toll on the traditional market Fear & Greed Index, which is now back in its “fear” zone at 28/100, according to data from CNN.

It is not just the financial world feeling the pinch, the so-called “Misery Index,” which measures inflation and unemployment, is giving signs that economist Lyn Alden describes as “not great.”

“Combined with how much debt/GDP exists now compared to the past, no wonder consumer sentiment is at record lows,” she commented on Fed data.

Misery Index chart. Source: Lyn Alden/ Twitter

“Opportunity of a lifetime?”

Given current circumstances, it may feel like there are no Bitcoin bulls left to offer a silver lining to the multiple clouds on the horizon.

Related: Top 5 cryptocurrencies to watch this week: BTC, FTT, XTZ, KCS, HNT

Zooming out, however, there are many who view the current market set up as a golden investment opportunity if exploited correctly.

Among them is Filbfilb, co-founder of trading suite DecenTrader, who over the weekend called Bitcoin the “opportunity of a lifetime.”

“Just to be clear, despite short/medium term issues which unfortunately are across the board, if you can survive and play your moves right without blowing up or risking too much so you have no capital, this is IMO the opportunity of a lifetime,” he wrote as part of a Twitter thread.

Like others, Filbfilb tied BTC performance to stocks, warning that the average hodler is blind to the “overleveraged” conditions that still exist on exchanges.

“They will feel the pinch,” he continued.

Contextualizing Bitcoin now within its four-year halving cycle, analyst Venturefounder, meanwhile, argued that the max pain scenario could enter in the coming weeks.

Currently midway through its cycle, BTC is in a place which has felt like bearish capitulation twice before — in both 2014 and 2018.

The views and opinions expressed here are solely those of the author and do not necessarily reflect the views of Cointelegraph.com. Every investment and trading move involves risk, you should conduct your own research when making a decision.

The total crypto market cap drops under $1.2T, but data show traders are less inclined to sell

An improving Tether discount in Asian markets and positive futures premiums for BTC and ETH suggest a slight recovery is in the making.

The total crypto market capitalization has been trading in a descending channel for the past 29 days and currently displays support at the $1.17 trillion level. In the past seven days, Bitcoin (BTC) presented a modest 2% drop and Ether (ETH) faced a 5% correction.

Total crypto market cap, USD billion. Source: TradingView

The June 10 consumer price index (CPI) report showed an 8.6% year-on-year increase and crypto and stock markets immediately felt the impact. Still, it’s not certain whether the figure will convince the United States Federal Reserve to hesitate in future interest rate hikes.

Mid-cap altcoins dropped further, sentiment is still bearish

The generalized bearish sentiment caused by weak macroeconomic data and uncertainties regarding the Federal Reserve’s ability to curb inflation has severely impacted crypto markets.

The Fear and Greed Index hit 11/100 on June 9, and the data-driven sentiment gauge has been below 20 since May 8.

Crypto Fear & Greed Index. Source: alternative.me

This persistent “extreme fear” reading indicates that investors are worried, but, at the same time, it supposedly presents a buying opportunity.

Below are the winners and losers from the past seven days. While the two leading cryptocurrencies presented modest losses, a handful of mid-capitalization altcoins declined by 14% or more.

Weekly winners and losers among the top 80 coins. Source: Nomics

Helium’s (HNT) community approved the HIP-51 proposal, covering the economic and technical constructions required to support new users, devices and different types of networks, including cellular, VPN and WiFi.

Chainlink (LINK) rallied 22% after the developers released a revamped Chainlink 2.0 roadmap, including native token staking.

Theta Token (THETA) gained 9.7% as the network announced livestream support using API technology which enabled instant and easy connection to apps and websites.

WAVES lost 28% after the $1,000 daily withdrawal limit for stablecoins in Vires Finance was implemented to avoid further pressure on the Neutrino Protocol Stablecoin (USDN).

Data shows traders are less inclined to sell at the current levels

The OKX Tether (USDT) premium is a good gauge of China-based retail crypto trader demand. It measures the difference between China-based peer-to-peer (P2P) trades and the United States dollar.

Excessive buying demand tends to pressure the indicator above fair value at 100%, and during bearish markets, Tether’s market offer is flooded and causes a 4% or higher discount.

Tether (USDT) peer-to-peer vs. USD/CNY. Source: OKX

On May 31, the Tether price in Asian peer-to-peer markets entered a 4% discount, signaling intense retail selling pressure. Curiously, the situation improved on June 10 after the indicator moved to a 1.5% discount. Despite remaining negative, the metric shows investors’ willingness to buy the dip as the total crypto capitalization dropped below $1.2 trillion.

To exclude externalities specific to the Tether instrument, traders must also analyze the cryptos futures markets. Perpetual contracts, also known as inverse swaps, have an embedded rate that is usually charged every eight hours. Exchanges use this fee to avoid exchange risk imbalances.

A positive funding rate indicates that longs (buyers) demand more leverage. However, the opposite situation occurs when shorts (sellers) require additional leverage, causing the funding rate to turn negative.

Accumulated perpetual futures funding rate on June 10. Source: Coinglass

Perpetual contracts reflected mixed sentiment after Bitcoin and Ether held a slightly positive (bullish) funding rate, but altcoin rates were negative. For example, BNB’s negative 0.20% weekly rate equals 0.8% per month, which is generally not a concern for derivatives traders.

Any recovery depends on macroeconomic data stabilizing

According to derivatives and trading indicators, investors are less inclined to reduce their positions at current levels, as shown by the modest improvement in the Tether premium.

The positive funding rate for Bitcoin and Ether futures displays traders’ growing appetite for leveraged long positions as the total crypto capitalization broke below $1.2 trillion.

Unless the traditional markets and macroeconomic scenario deteriorates, there is reason to believe crypto investors are expecting a positive price move soon.

The views and opinions expressed here are solely those of the author and do not necessarily reflect the views of Cointelegraph. Every investment and trading move involves risk. You should conduct your own research when making a decision.

Bitcoin price threatens lowest weekly close since 2020 as inflation spooks markets

BTC price action needs to reclaim the $29,500 mark to avoid resuming its pattern of lower lows on the weekly chart.

Bitcoin (BTC) dropped to two-week lows on June 11 as the week’s Wall Street trading ended with bears in control.

BTC/USD 1-hour candle chart (Bitstamp). Source: TradingView

U.S. inflation print proves setback

Data from Cointelegraph Markets Pro and TradingView followed BTC/USD as it reached $28,528 on Bitstamp, its lowest since May 28.

The pair had fallen in step with stock markets on June 10, these finishing the week noticeably down — the S&P 500 and Nasdaq Composite lost 2.9% and 3.5%, respectively.

This was on the back of surprisingly high inflation data from the United States, which took a turn for the worst in stark contrast to expectations. As Cointelegraph previously reported, at 8.6%, annual inflation came in at the highest since December 1981.

Reacting, market commentators were thus firmly on the bearish side when it came to future BTC price action.

“When we drop to $22,000 – $24,000 on Bitcoin they will call for lower Don’t be too greedy when the time comes,” popular Twitter account Crypto Tony told followers.

Filbfilb, co-founder of trading suite DecenTrader, meanwhile, contrasted the current environment with the March 2020 COVID-19 crash. This year’s slow bleed, he argued, was if anything more painful than the “car crash” price declines of the time that briefly took Bitcoin to $3,600.

“Inflation hasn’t peaked, and neither has Bitcoin,” MicroStrategy CEO Michael Saylor offered in a more hopeful angle after the data print.

“In the current macro backdrop it doesn’t matter how many charts are showing confluence that we are reaching historically oversold levels,” popular Twitter account PlanC countered:

“As long as Bitcoin remains correlated to risk on assets I don’t see a significant trend reversal anytime soon.”

If it were to end the week at current levels or any below $29,450, meanwhile, BTC/USD would be threatening its lowest weekly close since December 2020.

BTC/USD 1-week candle chart (Bitstamp). Source: TradingView

Doubts over rate hikes emerge

Looking ahead, forthcoming decisions on rate hikes in response to inflation were primed to be the major focus of the coming week.

Related: BTC price snaps its longest losing streak in history — 5 things to know in Bitcoin this week

The Federal Reserve’s Federal Open Markets Committee (FOMC) minutes, due for the meeting on June 14-15, will provide clues on how aggressive policymakers plan to be when it comes to stemming price rises.

“I think that at some point, the market will realize that inflation is not going away soon and that rates will still be relatively low,” Twitter account Daan Crypto Trades argued.

It added that gold could provide an early indication of that “new old” trend by rising from its current trading channel.

“$GOLD could be the leading factor in such a shift. Closely watching that. Right now, we’re still in the process of baking in the bad factors,” a post on the day read.

XAU/USD 1-day candle chart. Source: TradingView

The views and opinions expressed here are solely those of the author and do not necessarily reflect the views of Cointelegraph.com. Every investment and trading move involves risk, you should conduct your own research when making a decision.

Bitcoin, altcoins sell-off on record-high inflation, but traders still expect BTC to consolidate

Global financial markets and crypto sold off after June 10’s 8.6% CPI print showed inflation remains a persistent challenge.

Global financial markets once again find themselves trending lower on June 10 after the Consumer Price Index (CPI) came in at a blistering 8.6% year-over-year increase, the highest print since 1981. 

The hotter-than-expected CPI print resulted in a collapse of the $30,000 support and Bitcoin (BTC) price sold off to a daily low of $28,852 before dip buyers managed to bid the price back above $29,000.

BTC/USDT 1-day chart. Source: TradingView

Here’s what several analysts in the market are saying about the outlook for Bitcoin moving forward since there appears to be little relief on the inflation front and the Federal Reserve is still determined to raise interest rates.

Dollar strength weighs heavily on risk assets

The effect of the high CPI print on two benchmarks of financial markets, the dollar index (DXY) and the S&P 500 (SPX), was touched on by il Capo of Crypto, who posted the following charts noting that “After CPI results, #DXY continues its pump and #SPX keeps free-falling.”

DXY 4-hour chart vs. SPX 2-hour chart. Source: Twitter

Market analyst Kevin Svenson also said that the Fed’s inability to curb inflation is likely to translate to choppy price action for the next year.

There’s potential for a pullback below $28,000

Should the price of BTC continue to trend lower, crypto trader and pseudonymous Twitter user Altcoin Sherpa says trading below $28,000 is possible.

BTC/USD 4-hour chart. Source: Twitter

Altcoin Sherpa said,

“$BTC: EMAs look the best they’ve looked in a while on the 4h but the overall high time frame market structure remains bearish. Not really doing anything active rn, just observing. Seems clear that $28K> is next up if this current area gets lost.

Related: Bitcoin price falls under $29.5K after ‘unexpected’ 40-year high US inflation

BTC needs to reclaim $30K to prevent further downside

Insight into what it would take to avoid a pullback to the support at $28,000 was provided by market analyst and pseudonymous Twitter user CrediBULL Crypto, who posted the following chart showing the “unfortunate” retrace from $30,000, the area. The analyst suggested that this “was the moment where we needed to see follow through.”

BTC/USD 2-hour chart. Source: Twitter

CrediBULL Crypto said,

“On support, but it’s been tested four times now, so more likely it gives way to $28K. IF we can get back above $30K, then $28K may be avoided.”

The overall cryptocurrency market cap now stands at $1.192 trillion and Bitcoin’s dominance rate is 46.6%.

The views and opinions expressed here are solely those of the author and do not necessarily reflect the views of Cointelegraph.com. Every investment and trading move involves risk, you should conduct your own research when making a decision.

Bitcoin stocks correlation ‘feels like’ 100% as $30K BTC price frustrates

Bitcoin simply will not budge from its multi-week range, and morale is suffering as a result.

Bitcoin (BTC) wicked through $30,000 during June 9 as the Wall Street open revealed an ongoing stocks correlation. 

BTC/USD 1-hour candle chart (Bitstamp). Source: TradingView

Trader sees “relief” from US CPI print

Data from Cointelegraph Markets Pro and TradingView showed BTC/USD threatening to head lower as the S&P 500 likewise opened with modest losses.

The pair had stayed in a tight range through June 8, this following episodes of volatility, which proved dangerous for long and short traders alike.

“The correlation between the $SPX and $BTC is again close to 1, it feels like,” Cointelegraph contributor Michaël van de Poppe tweeted on the day, summarizing the mood.

United States jobless claims data had little impact on markets, with the main event in the form of Consumer Price Index (CPI) data due June 10. 

Van de Poppe predicted that the readout, which covers the month of May, would not beat the April figure, this coming after data from Europe hinted that inflation was already slowing down.

“Going into tomorrow; I think we’ll see the same from the U.S. which can benefit relief,” part of a further Twitter post read.

Fellow trader and analyst Pentoshi, meanwhile, predicted that BTC/USD could run to as high as $35,000 before entering its next major corrective phase, once more based on stock market movements.

General sentiment, while low according to indicators, was one of frustration for seasoned market pundits.

“Bitcoin recently purchased a beautiful yet affordable home at a low-interest rate for 30 years in a quiet town called 30K. It apparently has settled in and intends to live there forever,” analyst and podcast host Scott Melker, known as the “Wolf of All Streets,” reacted to the current trend.

BTC/USD has focused on the $30,000 mark since May 9, its surrounding corridor broken only by the immediate aftermath of the Terra LUNA implosion.

BTC/USD 1-day candle chart (Bitstamp). Source: TradingView

2018 vs. 2020 for BTC price, says analyst

Focusing on whether the current range would break up or down, meanwhile, opinions still varied widely.

Related: Bitcoin will finish 2022 ‘flat, possibly up’ says analyst as Saylor bets on $1M BTC

While some had previously called for a dive to as low as $14,000 or worse, others remained convinced that May was more characteristic of a macro floor.

Van de Poppe had previously described predictions of $12,000 as “insane.”

Weighing the chances of either outcome, meanwhile, Twitter account Trader_J compared current price action to the 2018 bear market and cross-crypto crash of March 2020.

“$BTC is currently in the Bottom position of 2020. I have already said that it is exactly 2020. Maybe that’s the Bottom,” he told followers.

“If it’s a Bear Market, like 2014–2018. Then there will be another crash. 2020 vs Bear Market.”

An accompanying chart showed Bitcoin’s Risk Metric, a tool devised by crypto quant analyst Benjamin Cowen, supporting the idea that lower levels were unlikely to enter.

BTC/USD annotated chart with Risk Metric. Source: Trader_J/ Twitter

The views and opinions expressed here are solely those of the author and do not necessarily reflect the views of Cointelegraph.com. Every investment and trading move involves risk, you should conduct your own research when making a decision.

BTC price snaps its longest losing streak in history — 5 things to know in Bitcoin this week

The longest weekly losing streak in Bitcoin history is finally broken, but the mood among analysts is anything but unanimously bullish.

Bitcoin (BTC) starts a new week with some fresh hope for hodlers after halting what has been the longest weekly downtrend in its history.

After battling for support throughout the weekend, BTC/USD ultimately found its footing to close out the week at $29,900 — $450 higher than last Sunday.

The bullish momentum did not stop there, with the pair climbing through the night into June 6 to reach multi-day highs.

The price action provides some long-awaited relief to bulls, but Bitcoin is far from out of the woods at the start of what promises to be an interesting trading week.

The culmination will likely be United States inflation data — this, itself, a yardstick for the macroeconomic forces of the world globally. As time goes on, the impact of anti-COVID policies, geopolitical tensions and supply shortages is becoming all the more apparent.

Risk assets remain an unlikely bet for many, as central bank monetary tightening is seen to be apt to pressure stocks and crypto alike going forward.

Bitcoin’s network fundamentals, meanwhile, continue to adapt to the surrounding reality and its impact on network participants.

Cointelegraph takes a look at five factors to bear in mind when charting where BTC price action may be headed in the coming days.

Tenth time’s the charm for BTC weekly

It was a long time coming, but Bitcoin has finally closed out a “green” week on the weekly chart.

BTC/USD had spent a record nine weeks making progressively lower weekly closes — a trend that began in late March and ended up being the longest ever in its history.

On June 5, however, bears had no chance, pushing the pair to $29,900 before the new week began, this still being approximately $450 higher than the previous week’s closing price.

That event sparked several hours of upside, with local highs totaling $31,327 on Bitstamp at the time of writing — Bitcoin’s best performance since June 1.

While some celebrated Bitcoin’s newfound strength, others remained firmly cool on the prospects of a more substantial rally.

Cointelegraph contributor Michaël van de Poppe eyed the open CME futures gap from the weekend, this providing a lure for a return to $29,000.

“Still expecting this to be happening on Bitcoin,” he told Twitter followers.

“A drop towards the CME Gap at $29K would make a lot of sense before a short reversal towards $31.5K.”

A look at order book data reinforces the friction bulls are likely to face in the event of a continued breakout. At the time of writing, the area around $32,000 had more than $60 million in sell-side liquidity lined up on Binance alone.

BTC/USD order book data chart (Binance). Source: Material Indicators

For Il Capo of Crypto, a Twitter analytics account well known for its sobering takes on upcoming BTC price action, there was likewise little to feel confident about.

Nonetheless, the market was not without its optimism.

“Having a plan is more important than guessing the correct direction,” popular Twitter account IncomeSharks argued.

“I think we drop then go up, so I’ll be longing if this happens. If stocks open up green we could rally and I’ll pivot to alts to ride them up. TP level is at $34,000 for now.”

Countdown to U.S. CPI reado

U.S. inflation is at its highest since the early 1980s, but will it continue?

The market will find out this week as June 10 sees the release of Consumer Price Index (CPI) data for May.

One of the benchmarks for gauging how inflation is progressing, CPI prints have traditionally been accompanied by market volatility both within crypto and beyond.

The question for many is how much higher it can go as the aftermath of the Russia-Ukraine conflict and its impact on global trade and supply chains continues to play out.

In the United States, the Federal Reserve’s interest rate hikes are also under scrutiny as a result of prices surging.

The end of the “easy money” era is a difficult one for stocks and correlated crypto assets more generally, and that pain trend is expected not to end any time soon, regardless of inflation performance.

“Liquidity is going out of the market and what that means is it will have an impact on the equity markets,” Charu Chanana, market strategist at Saxo Capital Markets, told Bloomberg.

“We do expect that the drawdown in the equity markets still has some room to go.”

Chanana was speaking as Asian markets rallied in early week’s trading, led by China loosening its latest round of COVID-19 lockdown measures.

The Shanghai Composite Index was up 1.1% at the time of writing, while Hong Kong’s Hang Seng traded up more than 1.5%.

Beyond the intraday data, however, the mood when it comes to macro versus crypto is very much one of cold feet.

For trading firm QCP Capital, the latest contraction in U.S. M2 money supply — only its third in around twenty years — is another reason to not take any chances.

“This contraction in M2 has been a result of Fed hikes and forward guidance, which drove a surge in reverse repos (RRP) to all-time record levels. Banks and money market funds withdrew money from the financial system in order to park it with the Fed to take advantage of high overnight interest rates,” it wrote in the latest edition of its Crypto Circular research series.

“This draining of liquidity will only be exacerbated by the upcoming QT balance sheet unwind as well, beginning 1 June. We expect these factors to weigh on crypto prices.”

U.S. inflation data chart. Source: St. Louis Fed

Miner capitulation “very close”

Despite weeks of lower prices endangering their cost basis, Bitcoin miners have so far held off from a significant distribution of coins.

This may soon change, new analysis argues, sparking what has historically accompanied generational BTC price bottoms.

In a tweet on June 6, Charles Edwards, founder of crypto asset manager Capriole, highlighted a classic bottom signal in Bitcoin’s hash ribbons metric.

Hash ribbons measure miner profitability and have been historically accurate in correlating with price phases. Currently, the “capitulation” phase similar to March 2020 is underway, he explained but hodlers should do anything but sell as a result.

“Hash Ribbon miner capitulation is very close. Bitcoin mining profit margins are getting squeezed,” Edwards commented.

“Reminder: this is not a sell signal. The end of a capitulation period has historically set up some of the best long-term buys for Bitcoin.”

Bitcoin hash ribbons chart. Source: Charles Edwards/ Twitter

Previously, Cointelegraph reported on miners’ ongoing challenges, which now include a ban on the practice by the state of New York this month.

Fundamentals echo miner calm

Fluctuations in miner participation will have a palpable effect on Bitcoin’s hash rate and network difficulty.

So far, the hash rate has remained stable above 200 exahashes per second (EH/s), according to estimates, indicating that miners for the most part remain active and have not decreased activity over cost concerns.

Data covering Bitcoin’s network difficulty likewise presents a calm short-term picture.

At its upcoming automated readjustment this week, difficulty will decrease by less than 1%, again reflecting a relative lack of upheaval in the mining sphere.

By contrast, the previous readjustment two weeks ago saw a 4.3% reduction, marking the biggest reversal since July 2021.

Bitcoin hash rate, difficulty estimates chart. Source: BTC.com

Beyond the short term, a sense of optimism prevails among some of Bitcoin’s best-known commentators.

“As we see in the growth of its hash rate, today Bitcoin is roughly 50% cheaper yet 20% stronger than a year ago,” podcast host Robert Breedlove noted in part of a Twitter debate on June 5, arguing that this showed the “mobilization” of entrepreneurs interested in fueling Bitcoin’s growth.

Megawhales show “promising sign”

In terms of putting their money where their mouth is, Bitcoin’s biggest investors could be showing the way this month.

Related: Top 5 cryptocurrencies to watch this week: BTC, ADA, XLM, XMR, MANA

As noted by sentiment monitoring firm Santiment, entities controlling 1,000 BTC or more now own more of the BTC supply than at any point in the past year.

“The mega whale addresses of Bitcoin, comprised partially of exchange addresses, own their highest supply of $BTC in a year,” Santiment summarized on June 6.

“We often analyze the 100 to 10k $BTC addresses for alpha, but accumulation from this high tier can still be a promising sign.”

Bitcoin megawhale accumulation trends chart. Source: Santiment/ Twitter

Data from on-chain analytics firm CryptoQuant meanwhile allays fears that users are sending BTC en masse to exchanges for sale. The overall trend in decreasing exchange reserves continues and is at levels last seen in October 2018.

Bitcoin exchange reserves vs. BTC/USD chart. Source: CryptoQuant

The views and opinions expressed here are solely those of the author and do not necessarily reflect the views of Cointelegraph.com. Every investment and trading move involves risk, you should conduct your own research when making a decision.

5 reasons why Bitcoin could be a better long-term investment than gold

Crypto advocates often refer to Bitcoin as “digital gold,” but how does BTC stack up against gold as a long-term investment?

The emergence of forty-year high inflation readings and the increasingly dire-looking global economy has prompted many financial analysts to recommend investing in gold to protect against volatility and a possible decline in the value of the United States dollar. 

For years, crypto traders have referred to Bitcoin (BTC) as “digital gold,” but is it actually a better investment than gold? Let’s take a look at some of the conventional arguments investors cite when praising gold as an investment and why Bitcoin might be an even better long-term option.

Value retention

One of the most common reasons to buy both gold and Bitcoin is that they have a history of holding their value through times of economic uncertainty.

This fact has been well documented, and there’s no denying that gold has offered some of the best wealth protection historically, but it doesn’t always maintain value. The chart below shows that gold traders have also been subject to long bouts of price declines.

Gold price. Source: TradingView

For example, a person who bought gold in September of 2011 would have had to wait until July 2020 to get back in the green, and if they continued to hold, they would once again be near even or underwater.

In the history of Bitcoin, it has never taken more than three to four years for its price to regain and surpass its all-time high, suggesting that on a long-term timeline, BTC could be a better store of value.

Could Bitcoin be a better inflation hedge?

Gold has historically been seen as a good hedge against inflation because its price tended to rise alongside increases in the cost of living.

But, a closer look at the chart for gold compared with Bitcoin shows that while gold has seen a modest gain of 21.84% over the past two years, the price of Bitcoin has increased 311%.

Gold vs. BTC/USDT 1-day chart. Source: TradingView

In a world where the overall cost of living is rising faster than most people can handle, holding an asset that can outpace the rising inflation actually helps increase wealth rather than maintain it.

While the volatility and price declines in 2022 have been painful, Bitcoin has still provided significantly more upside to investors with a multi-year time horizon.

Bitcoin could mirror gold during geopolitical uncertainty

Often called the “crisis commodity,” gold is well-known to hold its value during times of geopolitical uncertainty as people have been known to invest in gold when world tensions rise.

Unfortunately for people located in conflict zones or other areas subject to instability, carrying valuable objects is a risky proposition, with people being subject to asset seizures and theft.

Bitcoin offers a more secure option for people in this situation because they can memorize a seed phrase and travel without fear of losing their funds. Once they reach their destination, they can reconstitute their wallet and have access to their wealth.

The digital nature of Bitcoin and the availability of multiple decentralized marketplaces and peer-to-peer exchanges like LocalBitcoins provides a greater opportunity to acquire Bitcoin.

The dollar keeps losing value

The U.S. dollar has been strong in recent months, but that is not always the case. During periods where the dollar’s value falls against other currencies, investors have been known to flock to gold and Bitcoin.

If various countries continue to move away from being U.S. dollar centric in favor of a more multipolar approach, there could be a significant amount of flight out of the dollar but those funds won’t go into weaker currencies.

While gold has been the go-to asset for millennia, it’s not widely used or accepted in our modern digital society and most people in younger generations have never even seen a gold coin in person.

For these cohorts, Bitcoin represents a more familiar option that can integrate into people’s digitally-infused lifestyles, and it doesn’t require extra security or physical storage.

Related: Argentines turn to Bitcoin amid inflation worries: Report

Bitcoin is scare and deflationary

Many investors and financial experts point to scarcity and supply constraints for gold following years of declining production as a reason gold is a good investment.

It can take five to ten years for a new mine to reach production, meaning rapid increases in supply are unlikely and central banks significantly slowed their rate of selling gold in 2008.

That being said, it is estimated that there is still more than 50,000 metric tons of gold in the ground, which miners would happily focus on extracting in the event of a significant price increase.

On the other hand, Bitcoin has a fixed supply of 21 million BTC that will ever be produced, and its issuance is happening at a known rate. The public nature of the Bitcoin blockchain allows for the location of every Bitcoin to be known and verified.

There’s no way to ever really locate and validate all of the gold stores on this planet, meaning its true supply will never really be known. Because of this, Bitcoin wins the scarcity debate, hands down, and it is the hardest form of money created by humankind to date.

Want more information about trading and investing in crypto markets?

The views and opinions expressed here are solely those of the author and do not necessarily reflect the views of Cointelegraph.com. Every investment and trading move involves risk, you should conduct your own research when making a decision.