Gold

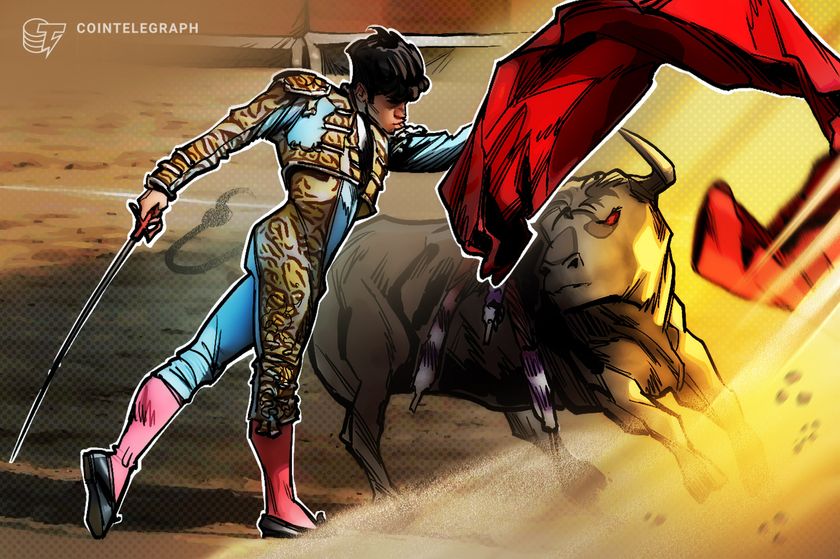
Breakout or $40K bull trap? 5 things to know in Bitcoin this week

Bitcoin surges past the key $40,000 amid a macro liquidity boost, but traders’ predictions include a BTC price crash of 25% or more.

Bitcoin (BTC) starts the first week of December looking better than it has since early 2022 — at over $40,000.

BTC price action is delighting bulls already as the month begins, with the weekly close providing the first trip above the $40,000 mark since April last year.

Shorts are getting wiped and liquidity taken as the bull run sees its latest boost on the back of macroeconomic changes and anticipation of the United States’ first spot price exchange-traded fund (ETF).

Despite misgivings and some predicting a major price retracement, Bitcoin continues to offer little respite for sellers, who continually miss out on profits or are left waiting on the sidelines for an entry price that never comes.

The party mood is not just reflected on markets — Bitcoin miners are busy preparing for the halving, and with the hash rate already at all-time highs of its own, the trend is set to continue this week.

Is there more upside left, or is Bitcoin getting ahead of itself?

This is the question that longtime market participants will be asking in the coming days as legacy markets open and adjust to a post-$40,000 BTC price.

Read more

Bitcoin ignores US jobs data as BTC price dip puts $28K support at risk

Eyes are on $28,000 support to hold in the event of continued downside, but Binance order book data warns that even this may be “rugged.”

Bitcoin (BTC) recovered from new 10-day lows at the April 20 Wall Street open as the United States jobs data boosted investor confidence.

BTC/USD 1-hour candle chart (Bitstamp). Source: TradingView

BTC price: “Lights out” at $28,000?

Data from Cointelegraph Markets Pro and TradingView showed BTC/USD reversing upward after hitting $28,360 on Bitstamp.

Amid an ongoing correction, the pair nonetheless failed to reclaim even $29,000 as support as U.S. unemployment data hinted that tighter financial conditions were working to cool inflation.

Spot gold became the main risk asset beneficiary, climbing back above $2,000 on the day.

XAU/USD 1-hour candle chart. Source: TradingView

U.S. equities opened higher but subsequently reversed their uptick, with the S&P 500 and Nasdaq Composite Index down 0.6%.

With BTC/USD circling $28,800 at the time of writing, popular Twitter trader and analyst Adam warned over the current range failing to hold.

“This seems like a ‘lose this level, and it’s lights out’ type of scenario,” he admitted alongside a chart showing the support range.

“Participation-wise, at lows pretty muted for my liking to get aggressive long here. Happy to buy reclaim above local S/R.”

BTC/USD annotated chart. Source: Adam/Twitter

Fellow trader Pierre, meanwhile, eyed a retest of a “no-trade zone” extending down to $27,000.

An additional post explained the likely upside and downside targets should BTC/USD fail to preserve a trend in place for multiple weeks on daily timeframes.

Data from the Binance order book showed bid liquidity thinning below spot an hour before the jobs data, with the nearest substantial support now at $28,000.

“Note: Local support just got rugged,” monitoring resource Material Indicators, which produced the data and uploaded it to Twitter, wrote in part of accompanying commentary.

“Some was placed to absorb a dump just above $28k. If it gets hit, expecting $28k to get rugged.”

BTC/USD order book data (Binance). Source: Material Indicators/Twitter

Crypto liquidations cool after 2023 record

With funding rates negative, long liquidations took a breather on the day after April 19 saw the largest tally of 2023.

Related: Can Bitcoin reclaim $30K? Watch these BTC price levels next

According to data from Coinglass, cross-crypto long liquidations on that date totaled $262 million, with the April 20 number at just $34 million.

Crypto liquidations chart. Source: Coinglass

Magazine: Bitcoin in Senegal: Why is this African country using BTC?

This article does not contain investment advice or recommendations. Every investment and trading move involves risk, and readers should conduct their own research when making a decision.

Bitcoin market cap flips tech giant Meta, widens gap on Visa

BTC’s market cap has climbed to the 11th spot among top assets by market cap, sitting behind electric vehicle maker Tesla.

Despite a turbulent week for crypto following the downfall of Silicon Valley Bank (SVB) and Signature Bank, Bitcoin’s (BTC) market cap has managed to flip that of tech giant Meta.

At the time of writing, data from Companies Market Cap shows Bitcoin’s market cap has reached $471.86 billion, surpassing Meta’s $469 billion.

Companies Market Cap provides real-time monitoring and ranking of market caps for cryptocurrencies, public companies, precious metals and exchange-traded funds.

Bitcoin’s market cap standing compared to other assets. Source: Companies Market Cap

Only 24 hours earlier, BTC’s market cap was nearly $37 billion below Meta’s, sitting at $433.49 billion.

However, Bitcoin’s market cap rose 9.7% in the past 24 hours, pushing the cryptocurrency to sit in the 11th spot among top assets by market cap, just below electric vehicle maker Tesla.

On Feb. 20, Cointelegraph reported that BTC had flipped the market cap of payment processing giant Visa for the third time in history, putting it just ahead of the payments company.

Related: Bitcoin on-chain data highlights key similarities between the 2019 and 2023 BTC price rally

The gap between the two market caps is now more than $20 billion, though it still is quite a distance from gold, which sits in first position with a $12.59 trillion market cap, followed by Apple in second place with a $2.380 trillion market cap.

BTC’s price has risen 8.72% in the past 24 hours, sitting at $24,441.

Bitcoin can still crack $50K if gold correlation continues — Chart

BTC price performance may encounter a new magnet above the $50,000 mark if gold continues to be a trendsetter.

Bitcoin (BTC) could get sucked toward $50,000 like a magnet if it continues to follow gold, fresh analysis predicts.

In a Twitter update on Jan. 26, popular trader and market commentator TechDev presented a lofty new BTC price target tied to XAU/USD.

Gold, Bitcoin inverse dollar correlation “without question”

As the debate over how much Bitcoin will compete with gold remains, bullish-price takes are surfacing.

For TechDev, the outlook is more optimistic than for many — Bitcoin might even crack the $50,000 mark.

“What if Bitcoin continues to follow Gold / DXY ?” he queried.

An accompanying chart compared BTC/USD to gold versus the U.S. Dollar Index (DXY). The precious metal, TechDev hinted while continuing a previous narrative, may be frontrunning Bitcoin in terms of its recovery.

BTC/USD vs. XAU/DXY annotated chart. Source: TechDev/Twitter

As Cointelegraph reported, the correlation between gold and Bitcoin is now practically 100%.

“Outside of momentary reactions to geopolitical events… You think gold has been leading bitcoin for 4 years?” a previous Twitter thread asked.

TechDev added that the idea was “not a forecast. A legitimate question.”

“Would be interesting if it does play out. Both assets’ inverse correlation to the dollar is without question,” he concluded.

Should Bitcoin keep chasing gold in relative terms, the outcome could be a game-changer for bulls. XAU/USD is up 6.1% year-to-date — already far below BTC/USD by 39%, per data from Cointelegraph Markets Pro and TradingView.

According to TechDev, Bitcoin now has a chance of passing not only $30,000, but even $50,000.

BTC/USD 1-hour candle chart (Bitstamp). Source: TradingView

Analyst: Gold set for imminent huge trade boost

Even gold bugs, traditionally far from allies of Bitcoin, are eyeing a new halcyon era for the metal’s own fortunes.

Related: Bitcoin faces ‘considerable danger’ from Fed in 2023 — Lyn Alden

Alasdair Macleod, head of research at Goldmoney, this week brought geopolitics to the fore in his forecast, predicting a major uptick in gold-based trade in Russia, China and across Asia.

“Russia will not make formal announcements about gold standards, because there is no need. Nor will China: instead it might reveal an increase in gold reserves,” part of a Goldmoney article released on Jan. 26 read.

Macleod himself is no Bitcoin fan, with a dedicated article comparing it with gold as money from December flatly predicting that the latter would win out in a crisis.

“To affirm its status as money, bitcoin will have to obey the laws of time preference. In other words, its current relationship with interest rates must change, so that rising interest rates reflecting fiat currencies’ loss of their purchasing power should become reflected in rising values for bitcoin,” he wrote.

“We will not try to guess this future. But we can say confidently that if the debasement of currencies accelerates, gold’s relative value will increase accordingly while that of bitcoin might not.”

Other popular commentators have been more complimentary, with Mike McGlone, senior macro strategist at Bloomberg Intelligence, frequently entertaining Bitcoin outpacing gold in the long term.

XAU/USD 1-day candle chart. Source: TradingView

The views, thoughts and opinions expressed here are the authors’ alone and do not necessarily reflect or represent the views and opinions of Cointelegraph.

Bitcoin due for shake-up vs. gold, stocks as BTC price dips under $22.5K

Bitcoin is still in line for a breakout, analysis concludes, as short-term weakness sees BTC price fall below $22,500.

Bitcoin (BTC) saw weakness at the Jan. 25 Wall Street open as United States equities fell in step. 

BTC/USD 1-hour candle chart (Bitstamp). Source: TradingView

BTC price faces stiff resistance

Data from Cointelegraph Markets Pro and TradingView showed BTC/USD heading below $22,500 after failing to crack resistance near five-month highs.

U.S. stocks saw a weak start to the session, with the S&P 500 and Nasdaq Composite Index down 1.1% and 1.6%, respectively, at the time of writing.

Bitcoin bulls had themselves faced trouble, attempting to push into an area of liquidity above $23,400, this so far remaining unchallenged and home to a significant number of would-be short liquidations.

Traders remained on the fence, hoping that a clearer trading signal would come after several days of essentially sideways price action.

“This is what I am looking for on Bitcoin with a corrective wave now, followed by another leg up to my $25,000 overall,” Crypto Tony commented alongside an explanatory chart.

“Invalidation is if we began to breakdown from here.”

BTC/USD annotated chart. Source: Crypto Tony/Twitter

Cointelegraph contributor Michaël van de Poppe was also opting to wait and see on the day.

“Patiently waiting for Bitcoin to drop beneath $22.3K or breaking and reclaim $23.1K. In between I don’t see much of an interesting set-up,” he told Twitter followers.

Some optimistic takes remained, including that from Crypto Ed, who eyed a potential higher low for BTC/USD setting the stage for new highs.

Fellow trader Kaleo even suggested that $30,000 would be Bitcoin’s next target.

Bitcoin correlation to gold surge

A topic of interest beyond price action, meanwhile, focused on Bitcoin’s correlation with both gold and stocks.

Related: Bitcoin faces ‘considerable danger’ from Fed in 2023 — Lyn Alden

Charles Edwards, CEO of crypto investment firm Capriole, noted that Bitcoin was continuing its historical tendency to play “catch-up” with gold.

“There is a relationship between Bitcoin and gold and gold is pumping,” he wrote.

“When you lag the gold price, it’s easier to see. Bitcoin tends to top between 0–6 months after gold and bottom 0–3 months after gold. This gap is approximate and will likely close with time.”

BTC/USD vs. XAU/USD annotated chart. Source: Charles Edwards/Twitter

Bitcoin’s correlation to gold stood at practically 100% on the day.

BTC/USD vs. XAU/USD chart. Source: TradingView

Conversely, Kaleo hoped for a “decoupling” from the S&P 500, with Bitcoin primed to break out to the upside.

“BTC broke out above HTF resistance dating back to the November ’21 ATH ~two weeks ago,” a further tweet stated.

“It looks like it’s about to continue that trend, as it’s currently on the verge of breaking out of a pennant it’s been accumulating in above support.”

BTC/USD vs. S&P 500 annotated chart. Source: Kaleo/Twitter

The views, thoughts and opinions expressed here are the authors’ alone and do not necessarily reflect or represent the views and opinions of Cointelegraph.

Bitcoin price stays near $23K as data shows hodlers not selling BTC

Seasoned Bitcoin market participants are anything but willing to take profit, even with the BTC price up 40% in January.

Bitcoin (BTC) refused to surrender gains at the Jan. 23 Wall Street open as United States equities opened higher.

BTC/USD 1-hour candle chart (Bitstamp). Source: TradingView

Dollar sags as risk assets reject retracement

Data from Cointelegraph Markets Pro and TradingView showed BTC/USD continuing to circle $22,800 at the time of writing.

The pair had managed to conserve its trading range over the weekend, with a local low of $22,315 allowing bulls to avoid a major setback.

The mood remained buoyant among risk assets on the day, with the S&P 500 up 1.3% and Nasdaq Composite Index trading 2% higher.

Gold, too, disappointed those hoping that a retracement would set in after weeks of impressive returns, something analyst Alisdair McLeod put down to classic principles of supply and demand.

“Attempts to knock back gold continue to fail,” he commented on the daily XAU/USD chart.

“While technical analysts point out a correction is due, they seem to be unaware that central banks are buying every ounce they can get their hands on.”

With that, an already flagging U.S. dollar index (DXY) managed only a modest rebound at the open before returning to trend downward, circling 102 at the time of writing.

U.S. dollar index (DXY) 1-hour candle chart. Source: TradingView

Among Bitcoin analysts, the jury remained out as to whether the current rally really did mark a trend change after more than a year of bear market.

“There are signs this could be the start of the bull, and there are also signs it’s a bear market rally. Until I see confirmations, I’m focused on the data that matters so I’ll know whether a potential breakout is a justifiable move or a higher probability of being a fakeout,” Keith Alan, co-founder of on-chain data resource Material Indicators, summarized.

BTC/USD annotated chart. Source: Keith Alan/ Twitter

Alan continued noting that one macro trigger in particular still needed to enter to call time on bears.

“According to the economic data we’ve seen so far, the uptrend in unemployment, which has historically marked bottoms, is still missing,” he wrote.

“Sure, maybe ‘this time is different’, but I’m looking for full candles above the 200 Week MA to consider it a confirmed breakout.”

Alan was referencing Bitcoin’s 200-week moving average, a key trend line which Bitcoin has yet to reclaim after losing it as support late last year.

BTC/USD 1-week candle chart (Bitstamp) with 200MA. Source: TradingView

Bitcoin hodlers resist the urge to sell

With Bitcoin up 40% in January, a further point of concern focused on the temptation to take profits.

Related: BTC metrics exit capitulation — 5 things to know in Bitcoin this week

In the latest edition of its weekly newsletter, “The Week On-Chain,” analytics firm Glassnode nonetheless pointed out that long-term holders remained broadly steadfast in their resolve to not exit the market — even after more than a year of losses.

“Analysis of cohort behavior shows that short-term holders and miners have been motivated by the opportunity to liquidate a portion of their holdings. On the contrary, the supply held by long-term holders continues to grow, which can be argued to be a signal of strength and conviction across this cohort,” part of its conclusion read.

“Given the effect of long-term holders on the macro trend, watching their spending is likely a key toolset to track over the coming weeks.”

Long-term holders are defined as entities keeping coins for at least 155 days.

Bitcoin % long-term and short-term holder supply in profit annotated chart (screenshot). Source: Glassnode

The views, thoughts and opinions expressed here are the authors’ alone and do not necessarily reflect or represent the views and opinions of Cointelegraph.

Bitcoin eyes $21.4K zone as analyst predicts BTC price will chase gold

Bitcoin’s trading range is “well defined” on exchanges but there is scope for a further breakout to copy gold.

Bitcoin (BTC) rose toward new multi-month highs on Jan. 20 as analysis predicted a new trading range above $18,000.

BTC/USD 1-hour candle chart (Bitstamp). Source: TradingView

Bitcoin price range “well defined”

Data from Cointelegraph Markets Pro and TradingView showed BTC/USD testing but preserving support at $21,000.

The pair edged higher at the Wall Street open, in line with United States equities as the third trading week of an explosive January drew to an end.

Despite misgivings over the rally’s fundamental strength, Bitcoin continued to avoid significant corrections, with exchange order book analysis revealing $23,000 as the next big resistance zone to crack.

“I view the lack of BTC liquidity below $18k and above $23k as a lack of sentiment for those levels at this time,” on-chain monitoring resource Material Indicators wrote in part of commentary about the Binance order book setup.

“Nothing changes sentiment like price moving through support or resistance, but for now, the trading range is well defined.”

BTC/USD order book data (Binance). Source: Material Indicators/ Twitter

An accompanying chart also revealed significant bid support in place at just above the psychologically significant $20,000 mark.

In terms of short-term targets, popular trader and analyst Crypto Ed hoped for a trip to $21,500 before a turnaround with a downside target of $19,800.

“I still believe that we will get there, and maybe we are already on our way over there,” he said in a YouTube update on the day.

The area around $21,400 was equally important for fellow trader CJ, who told Twitter followers that this would be a suitable place to “tag longs.”

Analyst: Bitcoin should “close gap” with gold

Zooming out, others focused on continued impressive moves by safe haven gold, which had hit a new nine-month high on Jan. 19.

Related: Bitcoin can pass $30K before setting new bear market low — forecast

In a Twitter debate, analysts eyed a potential continued game of catch-up between gold and Bitcoin, which researcher and data analyst James V. Straten argued had been a “mirror image” of each other in 2022.

“My bet BTC closes that gap soon,” he said while discussing the market implications of Federal Reserve policy.

Straten added that BTC/USD had already “retraced the entire FTX collapse and approaching the end of the narrative for DCG,” referring to ongoing problems for crypto finance conglomerate, Digital Currency Group.

BTC/USD vs. XAU/USD 1-day line chart. Source: TradingView

As Cointelegraph reported, expectations previously called for a copycat move on Bitcoin after gold took an early lead in recovering from lows.

The views, thoughts and opinions expressed here are the authors’ alone and do not necessarily reflect or represent the views and opinions of Cointelegraph.

Iran and Russia want to issue new stablecoin backed by gold

The potential stablecoin aims to enable cross-border transactions instead of fiat currencies like the U.S. dollar, the Russian ruble or the Iranian rial.

The Central Bank of Iran is reportedly cooperating with the Russian government to jointly issue a new cryptocurrency backed by gold.

According to the Russian news agency Vedomosti, Iran is working with Russia to create a “token of the Persian Gulf region” that would serve as a payment method in foreign trade.

The token is projected to be issued in the form of a stablecoin backed by gold, according to Alexander Brazhnikov, executive director of the Russian Association of Crypto Industry and Blockchain.

The stablecoin aims to enable cross-border transactions instead of fiat currencies like the United States dollar, the Russian ruble or the Iranian rial. The report notes that the potential cryptocurrency would operate in a special economic zone in Astrakhan, where Russia started to accept Iranian cargo shipments.

Russian lawmaker Anton Tkachev, a member of the Committee on Information Policy, Information Technology and Communications, stressed that a joint stablecoin project would only be possible once the digital asset market is fully regulated in Russia. After multiple delays, the Russian lower house of parliament once again promised to start regulating crypto transactions in 2023.

Iran and Russia are among the countries that banned their residents from using cryptocurrencies like Bitcoin (BTC) and stablecoins like Tether (USDT) for payments. At the same time, Iran and Russia have been actively working to adopt crypto as a tool of foreign trade.

Related: Russia to begin work on CBDC settlement system as sanctions endure

In August 2022, Iran’s Industry, Mines and Trade Ministry approved the use of cryptocurrency for imports into the country amid ongoing international trade sanctions. The local government said the new measures would help Iran mitigate global trade sanctions. Iran subsequently placed its first international import order using $10 million worth of crypto.

The Bank of Russia — historically opposed to using crypto as a payment method — agreed to allow crypto in foreign trade to mitigate the impact of international sanctions. The regulator has never clarified which cryptocurrencies would be used for such transactions though.

Bitcoin volatility may return in ‘catch up’ with gold in 2023

Both stocks and gold are leading the way when it comes to new year gains, but can Bitcoin match them?

Bitcoin (BTC) volatility is declining on schedule but BTC price action could still “play catch up” with gold this year.

The latest data and analysis show that despite sideways moves in Bitcoin, the largest cryptocurrency is behaving as expected.

BTC price volatility follows bear market pattern

With traders frustrated by a lack of tangible moves on BTC/USD, volatility is under the microscope at the start of 2023.

For analytics resource Ecoinometrics, however, there is nothing to worry about — Bitcoin is becoming more stable with time, and this is a feature, not a bug.

In Twitter comments on Jan. 2, it stated that “so far the pattern of less extreme volatile events as Bitcoin matures is confirmed.”

An accompanying chart of Bitcoin average one-month realized volatility distribution came with a description of BTC being “deep in a bear market.”

The data showed volatility ebbing at identical points in every four-year halving cycle, making 2022 firmly fit the trend of volatility decreasing more in each bear market year.

Bitcoin average one-month realized volatility distribution chart. Source: Ecoinometrics/ Twitter

Ecoinometrics nonetheless noted that volatility is not yet at record lows, contrary to data from newer sources such as the Bitcoin historical volatility index (BVOL).

Bitcoin historical volatility index (BVOL) 1-week candle chart. Source: TradingView

Bitcoin primed to follow stocks, gold, traders hop

In terms of triggers which could upend the status quo in volatility, investors may not need to look far.

Related: US will see new ‘inflation spike’ — 5 things to know in Bitcoin this week

In addition to the return of TradFi volume on Jan. 3, analysts are eyeing a potential game of cat and mouse between BTC/USD and gold.

“2023 will be one of the best yet for precious metals imo, will Bitcoin play catch up?” popular Twitter account Tedtalksmacro queried this week.

Comparing the two assets shows the impact of the FTX meltdown in November enduring for Bitcoin, while gold has seen a comparative renaissance. Until then, the two were in lockstep, data from Cointelegraph Markets Pro and TradingView shows.

BTC/USD vs. XAU/USD 1-day candle chart. Source: TradingView

Stocks may also provide a quicker boost to BTC price performance, with United States futures trending up before the year’s first Wall Street session, copying the 1-2% gains in Europe from the day prior.

“Bitcoin looks ready for continuation, but always difficult to call when U.S. opens up tomorrow,” Michaël van de Poppe, founder and CEO of trading firm Eight, predicted at the time:

“I’d be chasing the $16,6K area if you’re not in a position. Targets; $17-17,1K.”

BTC/USD annotated chart. Source: Michaël van de Poppe/ Twitter

The views, thoughts and opinions expressed here are the authors’ alone and do not necessarily reflect or represent the views and opinions of Cointelegraph.

Bitcoin price would surge past $600K if ‘hardest asset’ matches gold

The coming decade could be Bitcoin’s time to copy gold’s 1970s breakouts, says Capriole Investments.

Bitcoin (BTC) is due to copy gold’s explosive 1970s breakout as it becomes the world’s “hardest asset” in 2024.

That was one forecasted from the latest edition of the Capriole Newsletter, a financial circular from research and trading firm Capriole Investments.

Bitcoin due big moves “and more” in 2020s

Despite BTC price action flagging at nearly 80% below its latest all-time high, not everyone is bearish about even its mid-term outlook.

While calls for a further drop before BTC/USD finds its new macro bottom remain, Capriole believes that 2023 will be bright for Bitcoin as a revserve asset.

The reason, it says, lies in the world economy’s financial history of the past century, and in particular, the United States after the dollar deanchored from gold completely in 1971.

Gold, as the world’s premier safe haven of the time, saw “huge” gains during the decade, and fifty years later, it is Bitcoin’s turn.

“Because gold was much smaller in the 1970s (and Bitcoin today is even smaller by comparison), it had capacity to make big moves through a decade of inflation and high interest rates,” Capriole wrote:

“That’s one reason why we believe Bitcoin will do the same, and more, this decade.”

Accompanying charts underscored gold’s potential to repeat its 70s behavior, among which were a “cup and handle” chart structure playing out since 2010.

XAU/USD 1-month annotated chart. Source: Capriole Investments

When it comes to Bitcoin vying with gold for the safe haven crown, meanwhile, the potential lies in the numbers — at just 2.5% of gold’s market cap, BTC diving 80% from its $69,000 peak last year has little bearing on the overall picture.

“Given Bitcoin represents just 2.5% of gold’s market capitalization today, its 80% drawdown adds a mere 2% additional drawdown to the combined hard money (gold + Bitcoin) drawdown,” the newsletter continued.

“Giving a total hard money drawdown of 24% through to November 2022, comparable with the 1970 and 1975 figures for gold.”

Should the stage already be set for a Bitcoin copycat move of 70s gold, the growth potential is thus all the more impressive — even now, Bitcoin’s market cap is just 10% that of gold before its bull run of the time began.

“Bitcoin has more growth potential than gold because it is smaller. A like-for-like demand in both assets will result in a 40X greater price change for Bitcoin,” Capriole stated.

“The hardest asset in the world”

A further key argument echoed that long championed by commentators such as Saifedean Ammous in the popular book, The Bitcoin Standard.

Related: Bitcoin price ‘easily’ due to hit $2M in six years — Larry Lepard

There, the debate focuses on investors’ shift to Bitcoin as its inflation rate drops below that of gold, increasing its monetary “hardness” versus the metal:

“There are many other attributes that make Bitcoin stand out from gold, such as its equitable decentralization, ability to transfer instantaneously and be used for micro-payments. But most importantly, Bitcoin is harder than gold.”

This, Capriole added, will confirm Bitcoin as “the hardest asset in the world” at its next block subsidy halving in 2024.

“All-in-all, gold went up 24X in the 1970s,” Capriole summarized:

“Now imagine the 2020s, where the Fed can’t afford to be as aggressive (debt is way higher today) and we have digital, accessible, harder money: Bitcoin.”

BTC/USD chart with Bitcoin, gold inflation rate data. Source: Capriole Investments

The views, thoughts and opinions expressed here are the authors’ alone and do not necessarily reflect or represent the views and opinions of Cointelegraph.