Chiliz

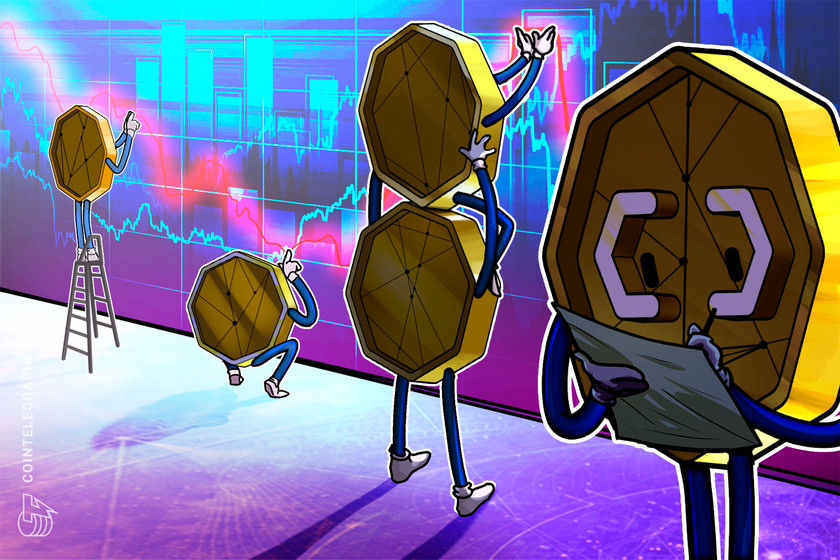
Chiliz launches layer-1 blockchain to expand fan token ecosystem

Fan token platform Chiliz validates the genesis block of its new layer-1 EVM-compatible blockchain to mark its five-year anniversary.

Five years from its inception, fan token platform Chiliz has launched its own layer-1 Ethereum Virtual Machine (EVM) compatible blockchain ecosystem to support its growth.

Chiliz’s fan token ecosystem has long been powered by Ethereum-based ERC-20 tokens, but the validation of the Chiliz 2.0 blockchain genesis block sees the ecosystem shift to its own layer 1. 

The new blockchain uses a system of 11 active validators with proof-of-stake authority consensus, which is touted to provide faster block times, lower fees and energy usage. 

According to the project’s documentation, Chiliz Chain 2.0 is a hard fork of BNB Chain, a go-to Ethereum fork. This means that the new layer-1 is EVM compatible, which is aimed to attract decentralized application developers to build within the environment.

Chiliz has made waves in the sports and entertainment space through its fan token app, Socios. The platform works with some of the biggest teams and brands in the sporting world, with major football teams like Barcelona, PSG, Manchester City, Arsenal and Juventus making use of its fan token platform.

Related: Socios boss’ goal? To knock crypto out of the park

The platform allows brands, teams and individuals to mint nonfungible tokens (NFTs), fan tokens and Web3-ready tickets, as well as develop DApps and Web3-based experiences and products.

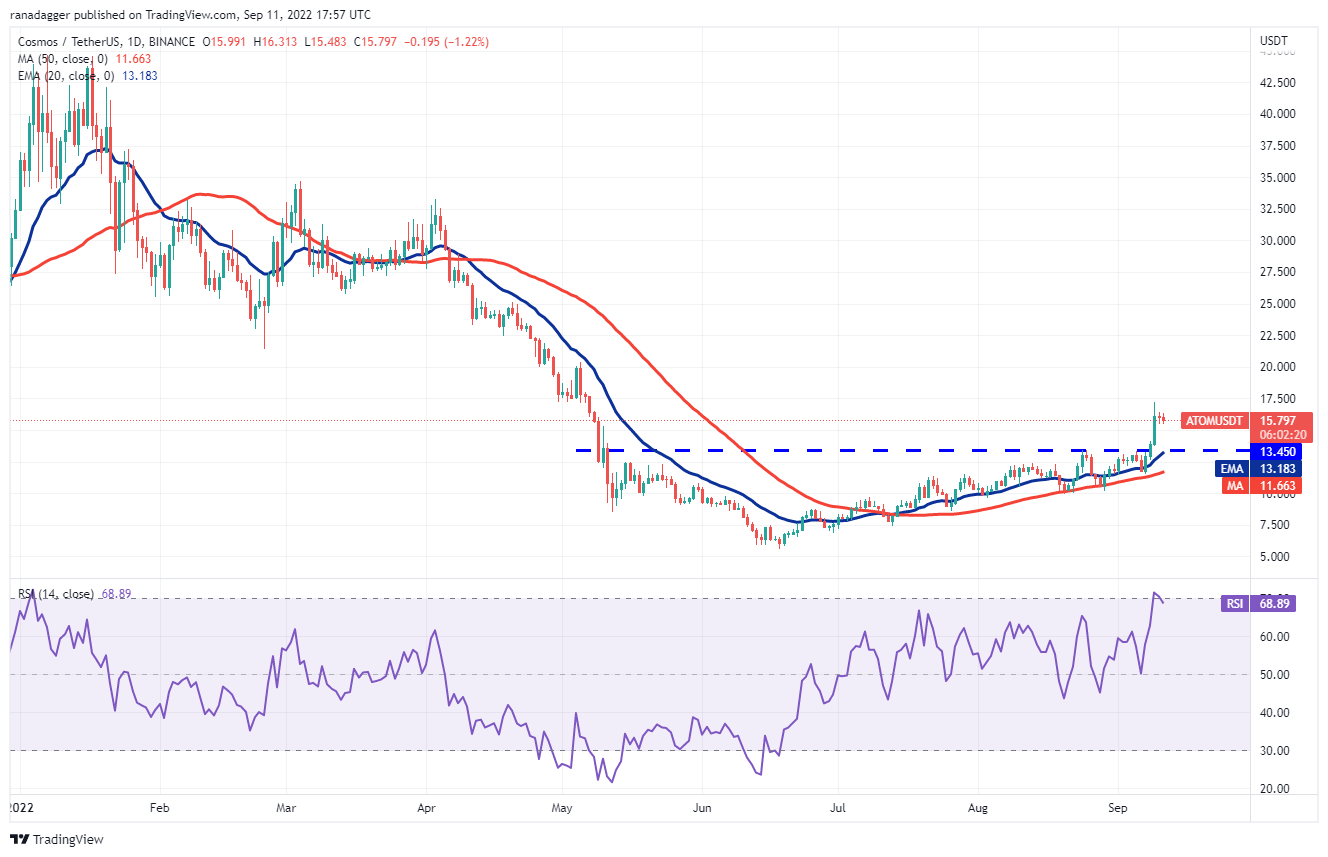
Cointelegraph spoke to Socios CEO Alexandre Dreyfus back in November 2022 at Web Summit in Lisbon about the upcoming launch of the Chiliz ‘2.0’ Blockchain. As he explained back then, the Chiliz chain already existed but was deliberately kept as a private ecosystem to protect intellectual property. At the time of that conversation, it had over 1.7 million wallets that participated in the issuance, minting and trading of fan tokens.

Dreyfus also pointed out the importance of Ethereum in providing the basis of its current ecosystem in correspondence on Feb. 9, highlighting both iterations of the Chiliz blockchain being forks of Ethereum:

“We use the technology as a foundation, but we adjust it and enhance it for our needs, which is the protection of the IP and the sports property we are working with.”

The launch of Chiliz 2.0 marks the transition to a “real open layer 1,“ Dreyfus told Cointelegraph, with on-chain governance holding the power to whitelist certain nodes and developers to issue assets.

“What does it mean? It means that you cannot have a fake NFT, a fake fan token or whatever.”

The CEO said that a patient approach, which allowed brands and franchises to maintain control of their image and property rights, was an important factor in the growth of its ecosystem over the past five years. The launch of the Chiliz blockchain is also aimed at handing back value to ecosystem participants:

“It’s a chain where mainly sports brands are going to govern, let’s say Barcelona or PSG, are going to become a node and stake their CHZ to get rewards and participate in the growth of the network.”

The sports industry continues to see synergies with blockchain-based firms. In January 2023, blockchain fantasy sports firm Sorare sealed a deal with the English Premier League to mint Ethereum-based digital player cards on its platform.

Argentina’s fan token sinks 31% after World Cup loss against Saudi Arabia

The price of soccer fan tokens, designed for fan engagement, is seemingly impacted by the on-field performance of teams.

Argentina’s shock 2-1 loss to Saudi Arabia in the opening match of the FIFA World Cup has plummeted the price of the Argentine Football Association Fan Token (ARG), in line with the hopes of the nation’s die-hard soccer fans. 

With the ARG token priced at $7.21 at kick-off, the poor performance by the Lionel Messi-led soccer team saw the token’s price fall 31% to $4.96 by the end of the match before rising to $5.22 at the time of writing, according to data from CoinGecko.

By contrast, the floor price of “The Saudis,” a Saudi Arabian-themed nonfungible token (NFT) collection unrelated to the soccer team, skyrocketed 52.6% from 0.196 Ether (ETH) to 0.3 ETH over the same time before cooling off to a price of 0.225 ETH, around $250.

The collection’s sales volume also spiked 990% over the last 24 hours, closing in on 24.5 ETH, according to OpenSea data.

Despite the built-up hype for the FIFA World Cup, which officially kicked off on Nov. 20, cryptocurrency research firm Delphi Digital noted that the fan engagement platform Socios’ native token Chiliz (CHZ), in addition to other soccer-based tokens representing participating nations, has also cooled off considerably over the last few days:

CHZ is an ERC-20 token native on Socios, a blockchain-powered fan engagement platform that has been one of the largest contributors to the sports-fan token boom.

Many of the soccer–based tokens run on Socios, which has partnerships with some of the largest soccer clubs in the world, including Barcelona F.C., Paris Saint-Germain F.C. and Manchester City F.C.

While the tokens don’t represent ownership in teams, the token allows buyers to vote in some decisions made by sponsoring teams in addition to enabling access to some rewards.

Related: Billions are spent marketing crypto to sports fans — Is it worth it?

Popularity for fan-based tokens in the sporting industry has surged lately, too, with token sales volumes often increasing more than 250% month-on-month since Jan. 2022.

Some appear to have viewed the tokens as an indirect way to bet on the success of such teams, despite them not being designed for that purpose.

The tokens are also impacted by factors other than the on-field success of soccer teams, such as the regular ebbs and flows of crypto markets and breaking news events. 

An example is the recent FTX collapse sending the price of CHZ falling by nearly 40% since the reports of the exchange’s liquidity issues and proceeding bankruptcy.

In May, smart contract platform Algorand became the first official blockchain-based sponsor for the FIFA World Cup, which is set to wrap up on Dec. 18.

TON, TWT, CHZ and QNT breakout amid traders’ crypto contagion fears

Bitcoin price is stuck in a tight range, but TON, CHZ, QNT and TWT caught a bid in the past week.

The FTX collapse continues to stoke fears of a contagion in the cryptocurrency space as investors wait to hear about businesses that may face the heat. One of the marquee names to come under the circle of suspicion is the Grayscale Bitcoin Trust (GBTC), which has seen its discount to Bitcoin’s (BTC) price reach record levels of about 50%.

Traders hate uncertainty and shy away from investing during these periods. That could be one of the reasons for the lack of buying interest in Bitcoin even after the sharp fall in its price. The Stock-to-Flow (S2F) model, which had seen its popularity soar during the bull phase, is coming under increasing criticism after the deviation between Bitcoin’s price and its projected price hit levels never seen before.

Does this suggest that the pessimism has reached an extreme or is it just that the S2F model is flawed?

Crypto market data daily view. Source: Coin360

During a bear market phase, the general trend is down, but there are always pockets of strength that may offer trading opportunities to long-only investors. However, rallies during bear markets are short-lived, hence traders may consider booking profits near strong resistance levels.

Let’s look at the charts of five cryptocurrencies that may attempt a rally in the near term.

BTC/USDT

Bitcoin continues to trade inside the tight range between $16,229 and $17,190. Generally, periods of tight consolidation are followed by an increase in volatility.

BTC/USDT daily chart. Source: TradingView

The downsloping moving averages and the relative strength index (RSI) in the negative zone indicate that the path of least resistance is to the downside. If the price breaks below $16,229, the Nov. 9 intraday low of $15,588 may be threatened. A break and close below this support could signal the resumption of the downtrend. The next support on the downside is $12,200.

If bulls want to avoid a further decline, they will have to push and sustain the price above the breakdown level of $17,622. Such a move will suggest strong demand at lower levels. The pair could then climb to the psychological level of $20,000.

BTC/USDT 4-hour chart. Source: TradingView

The BTC/Tether (USDT) pair has been trading near the moving averages, which have flattened out. This suggests that the pair has entered a state of equilibrium as both the buyers and sellers are undecided about the next directional move.

However, this uncertainty is unlikely to continue for long. If the price plummets below $16,229, the selling pressure could pick up momentum and the pair may drop to $15,588. If this support gives way, the pair may start the next leg of the downtrend.

On the contrary, if the price rises and breaks above $17,190, it will suggest that the current tight range was used by the bulls to accumulate. The pair could then rally to $18,200 and later to $18,730.

TON/USDT

Toncoin (TON) has recovered sharply from its June low and managed to hold on to a large part of the gains. This suggests that traders are in no hurry to dump their positions at higher levels.

TON/USDT daily chart. Source: TradingView

The TON/USDT pair has formed a symmetrical triangle, which usually acts as a continuation pattern. Both moving averages are gradually sloping up and the RSI is in the positive territory, indicating a slight advantage to the bulls.

If the price rebounds off the 20-day exponential moving average (EMA) of $1.65, the bulls will try to drive the price above the triangle. If they can pull it off, the pair could rally to $2.15 and thereafter climb toward the target objective of $2.87.

Alternatively, if the price slips below the 20-day EMA, the pair could drop to the 50-day simple moving average (SMA) of $1.50 and then to the support line.

TON/USDT 4-hour chart. Source: TradingView

The pair is facing stiff resistance at $1.80. Repeated failure to sustain the price above this level may have tempted short-term traders to book profits. The bears are trying to capitalize on this situation and sink the price below the 50-SMA. If this support cracks, the pair could dive to $1.55.

Conversely, if the price rebounds off the current level, the bulls will again try to scale the wall at $1.80. The repeated retest of a resistance level tends to weaken it. A close above this resistance could open the doors for a possible rally to $2.

CHZ/USDT

Chiliz (CHZ) is attempting to form an inverse head and shoulders pattern, which will complete on a break and close above the neckline. If that happens, it may signal the start of a new uptrend.

CHZ/USDT daily chart. Source: TradingView

The pattern target of the reversal formation is $0.54 but the bears are unlikely to give up easily. They are aggressively defending the neckline. If the price breaks below the 50-day SMA of $0.21, the CHZ/USDT pair could decline to $0.18 and subsequently to $0.14.

Alternatively, if the price bounces off the current level, buyers will again attempt to propel the pair above the neckline and gain control.

The flattening moving averages and the RSI just below the midpoint do not give a clear advantage either to the bulls or the bears. Hence, it is better to wait for the price to breakout before establishing fresh positions.

CHZ/USDT 4-hour chart. Source: TradingView

The pair turned down sharply from $0.27 and the bears have pulled the price below the moving averages. If the price sustains below the 50-SMA, the pair could drop to $0.20. That could put the bears in the driver’s seat.

On the other hand, if the price turns up from the current level and rises above the 20-EMA, it will suggest that traders are viewing the dips as a buying opportunity. The pair could then rise to $0.26 and later to $0.28. Buyers will have to drive the price above this level to challenge the resistance at $0.30.

Related: FTX funds on the move as thief converts thousands of ETH into Bitcoin

QNT/USDT

Although Quant (QNT) has corrected sharply in the past few days, it is attempting to take support and bounce off the support line. This indicates demand at lower levels.

QNT/USDT daily chart. Source: TradingView

The downsloping 20-day EMA of $128 indicates an advantage to the bears but the RSI is trying to form a positive divergence. This suggests that the selling pressure could be easing.

Buyers will have to propel and sustain the price above the 20-day EMA to indicate that the corrective phase may be over. The QNT/USDT pair could then rise to the 50-day SMA of $151 and thereafter to $180.

This positive view could invalidate in the near term if the price continues lower and breaks below the uptrend line. The pair could then drop to $87 and later to $79.

QNT/USDT 4-hour chart. Source: TradingView

The recovery in the pair is facing selling near the downtrend line. This suggests that the bears are active at higher levels. The bears have pulled the price below the moving averages and will try to extend the decline to $105 and then to $94.

To invalidate this negative view, the bulls will have to kick and sustain the price above the downtrend line. The pair could then rise to $125 where the bears may mount a strong defense. If buyers overcome this barrier, the up-move may reach $136.

TWT/USDT

While most major cryptocurrencies extended their downtrend in the past few days, Trust Wallet Token (TWT) has moved in the opposite direction and risen sharply. This indicates outperformance in the near term.

TWT/USDT daily chart. Source: TradingView

The TWT/USDT pair soared from $1.03 on Nov. 10 to $2.73 on Nov. 14, a 165% rally within a short time. That pushed the RSI deep into the overbought territory, suggesting a minor correction or consolidation in the near term and that is what happened.

The pair is finding support near the 50% Fibonacci retracement level of $1.88 but the bulls are struggling to push the price above $2.45. This suggests the pair may consolidate between $1.81 and $2.45 for a few days.

Both moving averages are sloping up and the RSI remains in the positive territory, indicating that bulls have the advantage. If buyers drive the price above the $2.45 to $2.73 resistance zone, the pair could resume its uptrend. This positive view could invalidate on a break and close below the 20-day EMA of $1.70.

TWT/USDT 4-hour chart. Source: TradingView

The bears pulled the price below the 50-SMA, but they are struggling to keep the pair down. This suggests strong buying at lower levels. If buyers push the price above the 20-EMA, the pair could rise to the downtrend line.

A break above this level could clear the path for a possible rally to $2.45. This remains the key hurdle for the bulls to overcome. If they succeed in breaking it, the pair may retest $2.73.

On the downside, a slide below $1.92 could result in a decline to $1.81. This is an important level to keep an eye on because a break below it could tilt the advantage in favor of the bears.

The views and opinions expressed here are solely those of the author and do not necessarily reflect the views of Cointelegraph.com. Every investment and trading move involves risk, you should conduct your own research when making a decision.

5 altcoins that could turn bullish if Bitcoin price stabilizes

If Bitcoin price stabilizes and begins to consolidate, these five altcoins could see strong upside.

The major United States stock market indexes continued their decline last week as worsening macroeconomic conditions increased concerns of a global recession. The Dow Jones Industrial Average closed at its lowest level in 2022, and major indexes recorded their fifth weekly close in the past six weeks.

Although Bitcoin (BTC) has only declined marginally this week, it risks closing at the lowest level since 2020. While a new multi-year weekly close is a negative sign, sellers will have to sustain the lower levels or else it may turn out to be a bear trap. The price action of the next few days is likely to witness heightened volatility as both the bulls and the bears battle it out for supremacy.

Crypto market data daily view. Source: Coin360

Several investors miss opportunities to buy during sharp corrections because they try to catch the bottom. Traders should rather focus on the projects they like and accumulate the coins in a phased manner lasting a few weeks or months. All coins do not bottom at the same time, hence it is better to focus on individual cryptocurrencies that show strength.

While Bitcoin is nearing its yearly lows, certain altcoins are holding up well. Let’s look at the charts of five cryptocurrencies that look interesting in the near term.

BTC/USDT

The Bitcoin bulls have successfully defended the $18,626 to $17,622 support zone in the past few days but they continue to face strong selling at the 20-day exponential moving average (EMA) of $19,720. This suggests that the bears continue to sell on minor rallies.

BTC/USDT daily chart. Source: TradingView

The downsloping moving averages indicate that the bears have the upper hand but the positive divergence on the relative strength index (RSI) suggests that the bearish momentum could be weakening.

A break and close above the 20-day EMA will be the first sign that the bears may be losing their grip. The BTC/Tether (USDT) pair could then rise to the 50-day simple moving average (SMA) of $21,043 and later to $22,799. Buyers will have to overcome this barrier to set the stage for a rally to $25,211.

Conversely, if the bears sink the price below the June low of $17,622, the selling could intensify, and the pair may resume its downtrend. The pair could then plummet to $14,500.

BTC/USDT 4-hour chart. Source: TradingView

The bulls are buying the dip below $18,626 but the bears continue to stall the recovery at the 50-SMA. This has squeezed the price between these two levels, but this tight range trading is unlikely to continue for long.

If the price turns down and sustains below $18,626, the bears may pull the pair to the vital support at $17,622. This level may again witness a strong battle between the bulls and the bears. On the upside, if the bulls thrust the price above the 50-SMA, the pair could rise to $20,400.

ATOM/USDT

Cosmos (ATOM) has been trading above the breakout level of $13.46 for the past several days, indicating that the sentiment remains positive and traders are buying on dips.

ATOM/USDT daily chart. Source: TradingView

The 20-day EMA of $14.22 has flattened out and the RSI is near the midpoint, indicating a balance between supply and demand. If the price breaks above $15.26, the short-term advantage could tilt in favor of the buyers. The ATOM/USDT pair could then rise to $17.20.

This level may again act as a resistance but if buyers thrust the price above it, the pair could pick up momentum and rise to $20.34 and later to $25.

Contrary to this assumption, if the price turns down and breaks below the 50-day SMA of $12.90, the advantage could tilt in favor of the bears. The pair could then decline to $10.

ATOM/USDT 4-hour chart. Source: TradingView

The pair has been stuck between $13.45 and $17 for some time. Buyers aggressively defended the support at $13.45 and are attempting to push the price above the 50-SMA. If they do that, the likelihood of a rally to $16 and thereafter to $17 increases.

Conversely, if the price turns down from the current level and breaks below the 20-EMA, it will suggest that bears continue to sell on rallies. That could pull the price to the strong support at $13.45. The sellers will have to sink the pair below $13 to clear the path for a possible drop to $11.50.

ALGO/USDT

The uncertainty of the range-bound action between $0.27 and $0.38 resolved to the upside on Sept. 23, indicating the start of a new up-move. If that happens, Algorand (ALGO) could still be in its first leg of the uptrend.

ALGO/USDT daily chart. Source: TradingView

The important level to watch on the downside is $0.38. If the bulls flip this level into support, it could increase the likelihood of the start of a new uptrend. The ALGO/USDT pair could then rally to $0.45 and later to $0.50.

This bullish view could invalidate in the near term if the price slips below $0.38 and re-enters the range. That could sink the price to the 20-day EMA of $0.33. If the price rebounds off this level, the bulls will again try to clear the overhead resistance.

ALGO/USDT 4-hour chart. Source: TradingView

The price rose above the overhead resistance at $0.38, but the bulls could not build upon this momentum. This shows that the bears have not yet given up and they continue to sell on rallies near $0.41.

If thebears pull the price below the 20-EMA, the pair could drop to $0.36. This is an important level for the bulls to defend because a break below it could open the doors for a possible drop to the 50-SMA.

On the upside, the bulls will have to push the price above $0.41 to signal the resumption of the up-move.

Related: What is scalping in crypto, and how does scalp trading work?

CHZ/USDT

Chiliz (CHZ) recovered sharply from its June lows and the bulls cleared the overhead resistance at $0.26 on Sept. 22, signaling the resumption of the up-move. When a coin moves against the market sentiment, it warrants a close look.

CHZ/USDT daily chart. Source: TradingView

The bears have been trying to sink the price below the breakout level of $0.26 for the past three days but the bulls have held their ground. This shows that the bulls are viewing the dips as a buying opportunity. The rising moving averages and the RSI in the positive territory indicate that buyers are in command.

If the price turns up and breaks above $0.28, the CHZ/USDT pair could rally to the next stiff resistance at $0.33.

Conversely, if the price turns down and breaks below $0.26, it will suggest that traders may be rushing to the exit. The pair could first drop to the 20-day EMA of $0.23 and later to the 50-day SMA of $0.21.

CHZ/USDT 4-hour chart. Source: TradingView

Both moving averages are sloping up indicating an advantage to buyers but the negative divergence on the RSI shows that the bullish momentum may be weakening. If the bears sink the price below $0.26, the pair could drop to the 50-SMA. This is a key level for the bulls to defend because if it gives way, the pair could drop to $0.22.

On the other hand, if the price rebounds off $0.26 and rises above $0.28, the up-move could resume. The pair could then rally to $0.32.

QNT/USDT

Quant (QNT) is showing strength as it is trading above both moving averages. Even when the sentiment across the cryptocurrency sector has been negative, it has managed to charge higher.

QNT/USDT daily chart. Source: TradingView

The bears had been defending the $112 level for the past many days but the bulls pierced through the resistance on Sept. 24 and pushed the price to the downtrend line. The long wick on the day’s candlestick shows that the bears are trying to stall the up-move at this level.

A minor positive is that the bulls bought the dip to $112 on Sept. 25, suggesting that buyers are trying to flip this level into support. The QNT/USDT pair could once again rise to the downtrend line. If this hurdle is cleared, the pair could soar to $133 and later to $154.

Alternatively, if the price turns down and breaks below $112, the next stop could be the 20-day EMA of $106. A break below this support could pull the pair to $95.

QNT/USDT 4-hour chart. Source: TradingView

The pair picked up momentum after breaking above $112 and reached near the downtrend line. This pushed the RSI into the overbought territory, which may have tempted the short-term traders to book profits.

The price rebounded off $112, indicating that the sentiment remains positive and traders are buying on dips. The pair could rise to $121 and thereafter to the downtrend line. On the downside, a break below $112 could sink the pair to the 50-SMA and thereafter to $95.

The views and opinions expressed here are solely those of the author and do not necessarily reflect the views of Cointelegraph. Every investment and trading move involves risk, you should conduct your own research when making a decision.

Total crypto market cap shows strength even after the Merge and Federal Reserve rate hike

Many of the top-80 cryptocurrencies dropped by 15%+ in the past week, but the Tether premium in Asia-based futures markets shows traders remain calm.

Cryptocurrencies have been in a bear trend since mid-August after they failed to break above the $1.2 trillion market capitalization resistance. Even with the current bear trend and a brutal 25% correction, it has not been enough to break the three-month-long ascending trend.

The crypto markets’ aggregate capitalization declined 7.2% to $920 billion in the seven days leading to Sept. 21. Investors wanted to play it safe ahead of the Federal Open Markets Committee meeting, which decided to increase the interest rate by 0.75%.

Total crypto market cap, USD billions. Source: TradingView

By increasing the cost of borrowing cash, the monetary authority aims to curb inflationary pressure while increasing the burden on consumer finance and corporate debt. This explains why investors moved away from risk assets, including stock markets, foreign currencies, commodities and cryptocurrencies. For instance, WTI oil prices ceded 6.8% from Sept. 14, and the MSCI China stock market index dropped 5.1%.

Ether (ETH) also saw a 17.3% retrace during the seven-day period and many altcoins performed even worse. The Ethereum network Merge and its subsequent impact on other GPU-mineable coins caused some skewed results among the worst weekly performers.

Weekly winners and losers among the top-80 coins. Source: Nomics

Chiliz (CHZ) rallied 21.5% following two successful fan token launches from MIBR esports team and the VASCO soccer team from Brazil.

XRP gained 16.6% after Ripple Labs called for a federal judge to immediately rule whether the company’s XRP token sales violated U.S. securities laws.

ApeCoin (APE) gained 15% as the community expects the staking program to launch, which shall be detailed by Horizen Labs on Sept. 22.

RavenCoin (RVN) and Ethereum Classic (ETC) retraced most of their gains from the previous week as investors realized the hash rate gains from Ethereum miners did not necessarily convert into higher adoption.

Traders’ appetite did not vanish despite the correction

The OKX Tether (USDT) premium is a good gauge of China-based crypto retail trader demand. It measures the difference between China-based peer-to-peer trades and the United States dollar.

Excessive buying demand tends to pressure the indicator above fair value at 100%, and during bearish markets, Tether’s market offer is flooded, causing a 4% or higher discount.

Tether (USDT) peer-to-peer vs. USD/CNY. Source: OKX

The Tether premium currently stands at 100.7%, its highest level since June 15. While still under the neutral area, the indicator showed a modest improvement over the past week. Considering that crypto markets tanked by 7.2%, this data should be viewed as a victory.

Perpetual contracts, also known as inverse swaps, have an embedded rate that is usually charged every eight hours. Exchanges use this fee to avoid exchange risk imbalances.

A positive funding rate indicates that longs (buyers) demand more leverage. However, the opposite situation occurs when shorts (sellers) require additional leverage, causing the funding rate to turn negative.

Accumulated perpetual futures funding rate on Sept. 21. Source: Coinglass

As depicted above, the accumulated seve-day funding rate was negative for every altcoin. This data indicates excess demand for shorts (sellers), although it could be dismissed in Ether’s case because investors aiming for the free fork coins during the Merge likely bought ETH and sold futures contracts to hedge the position.

More importantly, Bitcoin’s funding rate held slightly positive during a week of price decline and potentially bearish news from the FED. Now that this critical decision has been made, investors tend to avoid placing new bets until some new data provides insights on how the economy adjusts.

Overall, the Tether premium and futures’ funding rate show no signs of stress, which is positive considering how badly crypto markets have performed.

The views and opinions expressed here are solely those of the author and do not necessarily reflect the views of Cointelegraph. Every investment and trading move involves risk. You should conduct your own research when making a decision.

Crypto traders eye ATOM, APE, CHZ and QNT as Bitcoin flashes bottom signs

Bitcoin, ATOM, APE, CHZ and QNT are facing resistance at higher levels, but the chart patterns suggest that the current recovery may extend for a few more days.

The United States equities markets rallied sharply last week, ending a three-week losing streak. The S&P 500 rose 3.65% last week while the Nasdaq Composite soared 4.14%. Continuing its close correlation with the U.S. equities markets, Bitcoin (BTC) also made a strong comeback and is trying to end the week with gains of more than 7%.

The sharp rally in the stock markets and cryptocurrency markets are showing signs of a bottoming formation but it may be too early to predict the start of a new bull move. The equities markets may remain on the edge before the release of the U.S. inflation data on Sept. 13 and the Federal Reserve meeting on Sept. 20-21.

Crypto market data daily view. Source: Coin360

Along with taking cues from the equities markets, the cryptocurrency space has its own important events to look forward to. Both the Ethereum Merge and Cardano’s Vasil hard fork scheduled in the next few days could heighten volatility in several cryptocurrencies.

Although choppy markets increase the risk, they may offer short-term trading opportunities to nimble traders. Let’s study the charts of five cryptocurrencies that look interesting in the near term.

BTC/USDT

Bitcoin soared above the 20-day exponential moving average (EMA) of $20,662 on Sept. 9, which was the first indication that the selling pressure could be reducing. The bears are attempting to stall the recovery at the 50-day simple moving average (SMA) of $21,946, but a positive sign is that the bulls have not given up much ground.

BTC/USDT daily chart. Source: TradingView

The 20-day EMA has started to slope up gradually and the relative strength index (RSI) is in the positive territory indicating that the path of least resistance is to the upside. If the bulls propel the price above the 50-day SMA, the BTC/Tether (USDT) pair could rally toward the stiff overhead resistance at $25,211. The bears are expected to defend this level with vigor.

Another possibility is that the price turns down from the 50-day SMA. If that happens, the pair may drop to the 20-day EMA. This is an important level to keep an eye on because a break and close below it could open the doors for a drop to $18,626. Alternatively, if the price rebounds off the 20-day EMA, it will increase the likelihood of a break above the 50-day SMA.

BTC/USDT 4-hour chart. Source: TradingView

The pair picked up momentum after rising above the breakdown level of $19,520. The sharp rally pushed the RSI into the overbought territory, suggesting a minor consolidation or correction. Buyers are facing a stiff challenge near $22,000 but they have not ceded ground to the bears. This suggests that every minor dip is being purchased.

If the bulls propel the price above $22,000, the pair could quickly rally toward $23,500 where the bears may again attempt to stall the up-move.

Contrary to this assumption, if the price turns down and breaks below the 20-EMA, the pair could drop to $20,576. A break below this level will suggest that the pair may consolidate in a large range between $22,000 and $18,626 for some time.

ATOM/USDT

Cosmos (ATOM) broke above the overhead resistance of $13.45 on Sept. 8, indicating demand at higher levels. The next stiff resistance is at $20.30, which leaves room for a rally.

ATOM/USDT daily chart. Source: TradingView

However, before that, the bears will try to pull the price below the breakout level of $13.45. This is an important level to keep an eye on because a break and close below it will indicate that the recent breakout may have been a bull trap.

On the other hand, if the price turns up from the current level or rebounds off $13.45, it will suggest that the bulls are in control and are buying on every dip. If the bulls thrust the price above $17.20, the up-move may pick up momentum and reach $20.30.

ATOM/USDT 4-hour chart. Source: TradingView

The 4-hour chart shows that the ATOM/USDT pair surged after breaking above the overhead resistance at $13.45. That pushed the RSI deep into the overbought territory and started a correction, but a positive sign is that the bulls have not given up much ground.

If the price rebounds off the current level, the possibility of a break above $17.20 increases. If that happens, the up-move may continue and the pair may rally toward $20.30.

This positive view could invalidate in the near term if the price continues lower and plummets below the 20-EMA. If that happens, the pair could decline to the 50% Fibonacci retracement level of $14.36.

APE/USDT

ApeCoin (APE) rebounded strongly off the support at $4.17, indicating aggressive buying at lower levels. This suggests that the corrective phase could be ending, making it an interesting candidate for the short term.

APE/USDT daily chart. Source: TradingView

Buyers pushed the price above the 20-day EMA of $5.00 on Sept. 9 and the APE/USDT pair formed an inside-day Doji candlestick pattern on Sept. 10. This uncertainty resolved to the upside on Sept. 11 with a strong rally to the 50-day SMA of $5.85. The bears may try to stall the recovery at this level.

If the price turns down from the current level but rebounds off the 20-day EMA, it will suggest that the sentiment has turned positive and traders are buying on dips. The bulls will then again attempt to drive the price above the 50-day SMA. If they do that, the pair could soar toward the overhead resistance at $7.80.

This positive view could invalidate in the near term if the price turns down and breaks below the 20-day EMA. In that case, the pair may drop to $4.17.

APE/USDT 4-hour chart. Source: TradingView

The 20-EMA on the 4-hour chart has started to turn up and the RSI has risen into the overbought territory. This indicates that the bulls have the upper hand but a short-term pullback is possible.

If the price turns down from the current level but rebounds off $5.30, it will suggest strong demand at lower levels. The bulls will then make another attempt to push the price above $5.83 and extend the recovery to $6.44.

Alternatively, if the price turns down and breaks below the 20-EMA, the advantage may tilt in favor of the bears.

Related: Terra back from the dead? LUNA price rises 300% in September

CHZ/USDT

Chiliz (CHZ) broke above the 20-day EMA of $0.20 on Sept. 9, which was the first indication that the corrective phase may be ending. Hence, this token made it to the list.

CHZ/USDT daily chart. Source: TradingView

The bears tried to pull the price back below the 20-day EMA on Sept. 10, but the bulls have held their ground. Buyers are attempting to push the price toward the overhead resistance at $0.26, but the up-move may face strong headwinds near $0.23.

If the price turns down but does not fall below the 20-day EMA, it will increase the likelihood of a rally to $0.26. Contrary to this assumption, if the price turns down and breaks below $0.20, it will suggest that the bears are active at higher levels. That could pull the price to the 50-day SMA of $0.18.

CHZ/USDT 4-hour chart. Source: TradingView

The 4-hour chart shows that the bears are defending the downtrend line. If the price turns down from the current level but rebounds off the moving averages, it will suggest that the bulls are attempting a comeback.

Buyers will then again attempt to drive the price above the downtrend line. If they succeed, the pair may start its northward march toward $0.23 and later to $0.26.

Alternatively, if the price plummets below $0.20, it will suggest that the pair may remain inside the falling wedge pattern. That could pull the price down to $0.18.

QNT/USDT

Quant (QNT) did not break below the strong support at $87.60, indicating that the sentiment is positive and the bulls are buying on dips. That is the reason for its selection.

QNT/USDT daily chart. Source: TradingView

The sharp rebound off $87.60 broke above the 20-day EMA of $100 on Sept. 8, which was the first indication that the corrective phase may be ending. The bears posed a strong challenge near the 50-day SMA of $105 but could not sink the price back below the 20-day EMA.

This indicated that the sentiment had turned positive and the bulls are buying on dips. Buyers pushed the QNT/USDT pair above the 50-day SMA on Sept. 11. If the bulls sustain the higher levels, the pair could rise to $117 and then to $124. A break above this level could open the doors for a rally to $130.

This bullish view could be invalidated if the price turns down and breaks below the 20-day EMA. If that happens, the pair could drop to the strong support at $87.60.

QNT/USDT 4-hour chart. Source: TradingView

The 4-hour chart shows that the pair rebounded sharply off the support at $87.60. The bears posed a strong challenge near $108 but a positive sign is that the bulls purchased the dip to the 20-EMA. This indicates that traders are viewing dips as a buying opportunity.

Buyers resumed the recovery by pushing the price above the overhead resistance at $108. The pair could rally to $113 and later to $117. Conversely, if the price turns down and plummets below the 20-EMA, the pair could drop to the 50-SMA.

The views and opinions expressed here are solely those of the author and do not necessarily reflect the views of Cointelegraph. Every investment and trading move involves risk, you should conduct your own research when making a decision.

These 3 altcoins have completely ignored the bear market in the last 90 days

Several altcoins have not only outperformed Bitcoin and Ethereum in the last three months but have also posted impressive gains.

The cryptocurrency market overall endured a bad summer on back-to-back pieces of bad news, ranging from Terra’s (Luna) —now renamed Terra Classic (LUNC) — collapse to the Celsius Network’s liquidity crisis. But some tokens have bucked the downtrend and have actually seen their valuations go up over the summer.

Specifically, the last 90 days have seen these so-called alternative cryptocurrencies, or “altcoins,” outperforming top coins like Bitcoin (BTC) and Ether (ETH). Here are three among them:

Chiliz (CHZ)

Chiliz’s (CHZ) return in the last 90 days comes to be above 80%, the highest among the top-cap cryptocurrencies. Moreover, CHZ is down only 26% year-to-date compared with BTC and ETH losing 57% and 60%, respectively. 

Cryptocurrency performance (last 90 days). Source: blockchaincenter.net

On the daily chart, CHZ’s price reached $0.20 per piece on Aug. 29, and was looking to close the month in profit. Conversely, from a technical perspective, the Chiliz token stares at a potential 55% correction to $0.09 in September, based on the setup shown below.

CHZ/USD three-day price chart. Source: TradingView

Originally, the CHZ price rally started amid a rebound witnessed across the crypto market. But ts upside move picked momentum on a flurry of optimistic updates, including a partnership with crypto exchange Huobi Global and a nearly 25% acquisition of FC Barcelona’s Barça Studios.

Chiliz also benefited from the hype around its back-to-back network updates as it attempts to do away with Ethereum and launch its own chain CHZ 2.0.

Lido DAO (LDO)

Lido DAO (LDO) has rallied around 60% in the last 90 days primarily due to the euphoria around “the Merge,” Ethereum’s long-awaited network transition from proof-of-work to proof-of-stake in September.

Related: US dollar hits new 20-year high — 5 things to know in Bitcoin this week

Lido DAO helps underfunded users to become stakers on Ethereum’s upcoming proof-of-stake chain. It does so by collecting users’ Ether funds into a pool of 32 ETH—as required by the Ethereum network—and depositing them into the Merge’s official smart contract.

Ethereum 2.0 TVL staked by provider as of Aug. 28. Source: Glassnode

The prospects of Lido DAO attracting more users in the days leading to and after the Merge have triggered buying in an otherwise bear market.

But like Chiliz, LDO’s price risks plunging lower by 20% to $1.31 in September as shown in the setup below.

CHZ/USD daily price chart. Source: TradingView

The $1.31-target serves as the support in the consolidation area marked in red, given its historical performance.

Quant Network (QNT)

Quant Network (QNT) rose by more than 40% in the last 90 days, initially driven higher by a broader crypto market uptrend but picking momentum on speculations that their interoperable blockchain protocol would find adoption across governmental and regulatory bodies.

But from a technical perspective, QNT risks a 40% price decline from its current price level owing to the formation of a head-and-shoulders setup on its daily chart with a $57 target by September, as shown below.

QNT/USD daily price chart. Source: TradingView

Other winners

Ethereum Classic (ETC) has also surged by more than 40% in the last 90 days in hopes that it would offer a safe haven for Ethereum miners after the PoS upgrade.

WhilPolygon (MATIC) has rallied by 27% in the same period, followed by Uniswap (UNI), which is up 13%.

The views and opinions expressed here are solely those of the author and do not necessarily reflect the views of Cointelegraph.com. Every investment and trading move involves risk, you should conduct your own research when making a decision.

Rocky road lies ahead, but here’s 5 altcoins that still look bullish

Bitcoin price looks set for more downside, but this could present trade opportunities in MATIC, ATOM, XMR and CHZ.

The United States equities markets plunged on Aug. 26 following Federal Reserve Chair Jerome Powell’s speech where he reiterated the central bank’s hawkish stance. Continuing its correlation with the equities market, Bitcoin (BTC) and the cryptocurrency markets also witnessed a sharp selloff on Aug. 26.

Bitcoin has declined about 14% this month, making it the worst performance for August since 2015 when the price had dropped 18.67%. That may be bad news for investors because September has a dubious record of a 6% average loss since 2013, according to data from CoinGlass.

Crypto market data daily view. Source: Coin360

Although buying in a downtrending market is not a good strategy, traders can keep a close watch on cryptocurrencies that are outperforming the markets because, in case of any turnaround, these are likely to be the first off the block. In a bear market, traders should be patient because they are highly likely to find plenty of opportunities to buy after the market stabilizes.

What are the critical levels to watch on Bitcoin? If it stages a turnaround, what are the cryptocurrencies that may outperform in the short term? Let’s study 5 cryptocurrencies that are looking strong on the charts.

BTC/USDT

A weak rebound off a strong support indicates that bulls are hesitant to aggressively buy at the level. The bulls successfully defended the support line for several days but could not push the price above the 20-day exponential moving average ($21,806). This shows a lack of demand at higher levels.

BTC/USDT daily chart. Source: TradingView

Bears pounced upon the opportunity and pulled the price below the ascending channel on Aug. 26. The 20-day EMA is sloping down and the RSI is near the oversold zone, indicating that bears are firmly in the driver’s seat.

The BTC/USDT pair could drop to the strong support zone between $18,910 and $18,626. If the price rebounds off this zone, the bulls will try to push the price above the 50-day simple moving average ($22,340). If they manage to do that, the pair could rise to $25,211.

Conversely, if the price breaks below $18,626, the pair could retest the June 18 intraday low at $17,622. The bears will have to sink the price below this level to signal the resumption of the downtrend.

BTC/USDT 4-hour chart. Source: TradingView

The downsloping moving averages on the 4-hour chart indicate that bears are in command but the positive divergence on the relative strength index (RSI) suggests that the sell pressure could be reducing.

The first sign of strength will be a rise above the 20-EMA. If that happens, the pair could rise to the 50-SMA. A break above this level could signal that the correction may be over.

On the contrary, if the price breaks below $19,800, the selling could pick up momentum and the pair may plummet to the $18,910 to $18,626 zone.

MATIC/USDT

Polygon (MATIC) has rebounded off its strong support, which shows that bulls are defending the level aggressively. This increases the likelihood of the range-bound action continuing for a few more days. That is one of the reasons for focusing on this altcoin.

MATIC/USDT daily chart. Source: TradingView

The bulls are attempting to push the price above the moving averages. If they can pull it off, it will suggest that the MATIC/USDT pair could attempt a rally to the overhead resistance at $1.05. This level could attract strong selling by the bears.

Alternatively, if the price turns down from the moving averages, it will suggest that bears are selling on rallies. The bears will then attempt to sink the price below the crucial support at $0.75. If they succeed, the pair could decline to $0.63.

MATIC/USDT 4-hour chart. Source: TradingView

The bulls have pushed the price above the moving averages, which is the first indication that the selling pressure may be reducing. Another positive sign is that the RSI has made a positive divergence, a sign that the bears may be losing their grip.

The buyers will try to push the price above the overhead resistance at $0.84. If they succeed, the pair could rally to $0.91 which may again act as a strong resistance. To invalidate this positive view, the bears will have to sink the price below $0.75.

ATOM/USDT

Cosmos (ATOM) has been selected because it is trading above the 50-day SMA ($10.58) and is near the psychological support at $10.

ATOM/USDT daily chart. Source: TradingView

The bulls are expected to defend the zone between $10 and the 50-day SMA aggressively. If the price rebounds off this zone and rises above the 20-day EMA ($11.39), it will indicate that the selling pressure may be reducing.

The ATOM/USDT pair could then rise to the overhead resistance at $12.50 and later to $13.45. A break above this level could suggest that the downtrend may be over.

Contrary to this assumption, if the price turns down and slips below the support zone, it could start a deeper correction. The pair could then decline to $8.50.

ATOM/USDT 4-hour chart. Source: TradingView

The 20-EMA has turned down on the 4-hour chart and the RSI is in the negative territory, indicating that bears have the edge in the near term. The sellers will have to sink and sustain the price below the uptrend line to challenge the psychological support at $10.

Conversely, if the price rebounds off the uptrend line, it will suggest that bulls are buying the dips to this level as they have done on previous occasions. The buyers will have to push the price above the moving averages to open the doors for a possible rally to $12.50.

Related: Bitcoin threatens 20-month low monthly close with BTC price under $20K

XMR/USDT

Monero (XMR) has made it to the list because it is holding above its immediate support at $142. This suggests that lower levels are attracting buyers.

XMR/USDT daily chart. Source: TradingView

If bulls drive the price above the 20-day EMA ($153), it will suggest that the correction may be over. The XMR/USDT pair could pick up momentum if bulls drive the price above the overhead resistance at $158. If that happens, the pair could rally to $174. The bulls will have to clear this hurdle to signal the resumption of the up-move.

This positive view could invalidate in the near term if the price turns down and breaks below the strong support at $142. If that happens, the pair could slide to $132 and later to $117. The downsloping 20-day EMA and the RSI in the negative territory indicate that bears have a slight edge.

XMR/USDT 4-hour chart. Source: TradingView

The buyers are attempting to push the price above the 20-EMA. If they manage to do that, the pair could rise to the 50-SMA, which may again act as a stiff resistance. If bulls overcome this barrier, the pair could rise to $158. A break and close above this resistance will suggest a change in the short-term trend.

Conversely, if the price turns down from the 20-EMA, it will suggest that bears are selling on minor rallies. The pair could then decline to the strong support at $142. If this support cracks, it will suggest the start of a deeper correction.

CHZ/USDT

Chiliz (CHZ) has found a place in this list for the third consecutive week. That is because, even after the recent correction, it remains in an uptrend.

CHZ/USDT daily chart. Source: TradingView

Buyers pushed the price above the overhead resistance of $0.26 on Aug. 23 and Aug. 24 but they could not sustain the higher levels as seen from the long wicks on the candlesticks. This may have tempted the short-term traders to book profits. That pulled the price down to the breakout level of $0.20, which is just above the 20-day EMA ($0.20).

The bulls purchased this drop and are attempting to resume the up-move toward the overhead resistance at $0.26. The bulls will have to clear this hurdle to open the doors for a possible rally to $0.33.

The rising moving averages suggest advantage to buyers but the negative divergence on the RSI indicates that the bullish momentum may be weakening. If the price turns down and breaks below the 20-day EMA, the advantage will turn in favor of the bears. The pair could then decline to the 50-day SMA ($0.15).

CHZ/USDT 4-hour chart. Source: TradingView

The 20-EMA on the 4-hour chart is flattening out and the RSI has been oscillating near the midpoint, indicating a balance between buyers and sellers. This could keep the pair range-bound between $0.20 and $0.26 for some time.

The next trending move could start if bulls push and sustain the price above $0.26 or below $0.20. Until then, the bulls are likely to buy the dips to the support at $0.20 and sell near the overhead resistance at $0.26. Trading inside the range is likely to remain volatile and random.

The views and opinions expressed here are solely those of the author and do not necessarily reflect the views of Cointelegraph. Every investment and trading move involves risk, you should conduct your own research when making a decision.

Rocky road lies ahead, but here are 5 altcoins that still look bullish

Bitcoin price looks set for more downside, but this could present trade opportunities in MATIC, ATOM, XMR and CHZ.

The United States equities markets plunged on Aug. 26 following Federal Reserve Chair Jerome Powell’s speech, where he reiterated the central bank’s hawkish stance. Continuing its correlation with the equities market, Bitcoin (BTC) and the cryptocurrency markets also witnessed a sharp selloff on Aug. 26.

Bitcoin has declined about 14% this month, making it the worst performance for August since 2015, when the price had dropped 18.67%. That may be bad news for investors because September has a dubious record of a 6% average loss since 2013, according to data from CoinGlass.

Crypto market data daily view. Source: Coin360

Although buying in a down-trending market is not a good strategy, traders can keep a close watch on cryptocurrencies that are outperforming the markets because, in case of any turnaround, these are likely to be the first off the block. In a bear market, traders should be patient because they are highly likely to find plenty of opportunities to buy after the market stabilizes.

What are the critical levels to watch on Bitcoin? If it stages a turnaround, what are the cryptocurrencies that may outperform in the short term? Let’s study five cryptocurrencies that are looking strong on the charts.

BTC/USDT

A weak rebound off of a strong support indicates that the bulls are hesitant to buy aggressively at this level. The bulls successfully defended the support line for several days but could not push the price above the 20-day exponential moving average (EMA) of $21,806. This shows a lack of demand at higher levels.

BTC/USDT daily chart. Source: TradingView

The bears pounced upon the opportunity and pulled the price below the ascending channel on Aug. 26. The 20-day EMA is sloping down and the RSI is near the oversold zone, indicating that the bears are firmly in the driver’s seat.

The BTC/Tether (USDT) pair could drop to the strong support zone between $18,910 and $18,626. If the price rebounds off this zone, the bulls will try to push the price above the 50-day simple moving average (SMA) of $22,340. If they manage to do that, the pair could rise to $25,211.

Conversely, if the price breaks below $18,626, the pair could retest the June 18 intraday low at $17,622. The bears will have to sink the price below this level to signal the resumption of the downtrend.

BTC/USDT 4-hour chart. Source: TradingView

The downsloping moving averages on the 4-hour chart indicate that the bears are in command but the positive divergence on the relative strength index (RSI) suggests that the sell pressure could be reducing.

The first sign of strength will be a rise above the 20-EMA. If that happens, the pair could rise to the 50-SMA. A break above this level could signal that the correction may be over.

On the contrary, if the price breaks below $19,800, the selling could pick up momentum and the pair may plummet to the $18,910 to $18,626 zone.

MATIC/USDT

Polygon (MATIC) has rebounded off its strong support, which shows that the bulls are defending the level aggressively. This increases the likelihood of the range-bound action continuing for a few more days. That is one of the reasons for focusing on this altcoin.

MATIC/USDT daily chart. Source: TradingView

The bulls are attempting to push the price above the moving averages. If they can pull it off, it will suggest that the MATIC/USDT pair could attempt a rally to the overhead resistance at $1.05. This level could attract strong selling by the bears.

Alternatively, if the price turns down from the moving averages, it will suggest that thebears are selling on rallies. The bears will then attempt to sink the price below the crucial support at $0.75. If they succeed, the pair could decline to $0.63.

MATIC/USDT 4-hour chart. Source: TradingView

The bulls have pushed the price above the moving averages, which is the first indication that the selling pressure may be reducing. Another positive sign is that the RSI has made a positive divergence, indicating a sign that the bears may be losing their grip.

The buyers will try to push the price above the overhead resistance at $0.84. If they succeed, the pair could rally to $0.91, which may again act as a strong resistance. To invalidate this positive view, the bears will have to sink the price below $0.75.

ATOM/USDT

Cosmos (ATOM) has been selected because it is trading above the 50-day SMA of $10.58 and is near the psychological support at $10.

ATOM/USDT daily chart. Source: TradingView

The bulls are expected to defend the zone between $10 and the 50-day SMA aggressively. If the price rebounds off this zone and rises above the 20-day EMA of $11.39, it will indicate that the selling pressure may be reducing.

The ATOM/USDT pair could then rise to the overhead resistance at $12.50 and later to $13.45. A break above this level could suggest that the downtrend may be over.

Contrary to this assumption, if the price turns down and slips below the support zone, it could start a deeper correction. The pair could then decline to $8.50.

ATOM/USDT 4-hour chart. Source: TradingView

The 20-EMA has turned down on the 4-hour chart and the RSI is in the negative territory, indicating that th bears have the edge in the near term. The sellers will have to sink and sustain the price below the uptrend line to challenge the psychological support at $10.

Conversely, if the price rebounds off the uptrend line, it will suggest that the bulls are buying the dips to this level as they have done on previous occasions. The buyers will have to push the price above the moving averages to open the doors for a possible rally to $12.50.

Related: Bitcoin threatens 20-month low monthly close with BTC price under $20K

XMR/USDT

Monero (XMR) has made it to the list because it is holding above its immediate support at $142. This suggests that lower levels are attracting buyers.

XMR/USDT daily chart. Source: TradingView

If the bulls drive the price above the 20-day EMA of $153, it will suggest that the correction may be over. The XMR/USDT pair could pick up momentum if the bulls drive the price above the overhead resistance at $158. If that happens, the pair could rally to $174. The bulls will have to clear this hurdle to signal the resumption of the up-move.

This positive view could invalidate in the near term if the price turns down and breaks below the strong support at $142. If that happens, the pair could slide to $132 and later to $117. The downsloping 20-day EMA and the RSI in the negative territory indicate that the bears have a slight edge.

XMR/USDT 4-hour chart. Source: TradingView

The buyers are attempting to push the price above the 20-EMA. If they manage to do that, the pair could rise to the 50-SMA, which may again act as a stiff resistance. If the bulls overcome this barrier, the pair could rise to $158. A break and close above this resistance will suggest a change in the short-term trend.

Conversely, if the price turns down from the 20-EMA, it will suggest that the bears are selling on minor rallies. The pair could then decline to the strong support at $142. If this support cracks, it will suggest the start of a deeper correction.

CHZ/USDT

Chiliz (CHZ) has found a place in this list for the third consecutive week. That is because, even after the recent correction, it remains in an uptrend.

CHZ/USDT daily chart. Source: TradingView

Buyers pushed the price above the overhead resistance of $0.26 on Aug. 23 and Aug. 24 but they could not sustain the higher levels as seen from the long wicks on the candlesticks. This may have tempted the short-term traders to book profits. That pulled the price down to the breakout level of $0.20, which is just above the 20-day EMA of $0.20.

The bulls purchased this drop and are attempting to resume the up-move toward the overhead resistance at $0.26. The bulls will have to clear this hurdle to open the doors for a possible rally to $0.33.

The rising moving averages suggest an advantage to buyers but the negative divergence on the RSI indicates that the bullish momentum may be weakening. If the price turns down and breaks below the 20-day EMA, the advantage will turn in favor of the bears. The pair could then decline to the 50-day SMA of $0.15.

CHZ/USDT 4-hour chart. Source: TradingView

The 20-EMA on the 4-hour chart is flattening out and the RSI has been oscillating near the midpoint, indicating a balance between buyers and sellers. This could keep the pair range-bound between $0.20 and $0.26 for some time.

The next trending move could start if the bulls push and sustain the price above $0.26 or below $0.20. Until then, the bulls are likely to buy the dips to the support at $0.20 and sell near the overhead resistance at $0.26. Trading inside the range is likely to remain volatile and random.

The views and opinions expressed here are solely those of the author and do not necessarily reflect the views of Cointelegraph. Every investment and trading move involves risk, you should conduct your own research when making a decision.

3 reasons why Chiliz is up 35% this week — And where is CHZ price heading next?

A mix of fundamental, on-chain and technical catalysts has driven the CHZ price to its best levels since April 2022. What’s next?

The price of Chiliz (CHZ) has surged by approximately 35% week-to-date (WTD) to reach $0.26 per token on Aug. 24. In doing so, the token has outperformed Bitcoin (BTC) and Ether (ETH), which have been wobbling between gains and losses in the same period.

CHZ/USD versus BTC/USD and ETH/USD daily price chart. Source: TradingView

Here are the key catalysts that could be behind Chiliz’s breakaway rally.

CHZ 2.0

On Aug. 22, Chiliz founder Alexandre Dreyfus announced their intention to stop utilizing the Ethereum blockchain to launch their fungible and nonfungible tokens and replace it with its own native chain, CHZ 2.0.

“We don’t have to rely forever only on ERC20 or ERC721 equivalent,” said Dreyfus, adding:

“At @chiliz we think we can bring some innovation on top of fungible token formats. As we work with 100+ of the biggest brands in the world, it is easier to deploy and scale.”

The announcement coincided with CHZ undergoing a 19% intraday price rally on Aug. 22, accompanied by a spike in trading volume. From a technical perspective, the move showed traders’ conviction in the CHZ 2.0 announcement.

CHZ/USD daily price chart. Source: TradingView

The return of Chiliz whales

CHZ’s price boom this week further coincided with the rise in whale activities.

Notably, the number of CHZ transactions whose value exceeds $100,000 reached 105 on Aug. 23, its highest since March 29, according to data provided by Santiment. Moreover, CHZ’s price rallied nearly 12.5% on the same day.

Chiliz price versus whale activity. Source: Santiment

The parallel rise in CHZ’s whale activity, volume and price suggest that most rich investors have been buying the token after the CHZ 2.0 announcement.

Technical breakout underway

Chiliz’s ongoing price rally comes as a part of a technical breakout move that started mid-August.

On the daily chart, CHZ broke out of its prevailing cup and handle setup on Aug. 14 after closing above the pattern’s neckline range (the red bar), as shown below. A cup and handle pattern is considered a bullish reversal setup by traditional chart analysts.

The technical setup, coupled with the CHZ 2.0 announcement, could have influenced traders to remain bullish on CHZ. It could also mean that the token would keep rallying until it hit the cup and handle pattern’s profit target at around $0.32, up another 35% from Aug.’s price.

Related: Blockchain, crypto set to take sports industry beyond NFT collectibles

The target is determined by measuring the cup and handle’s maximum height and adding the outcome to the neckline. In other words, CHZ price could reach it by September, given it current upside momentum.

The views and opinions expressed here are solely those of the author and do not necessarily reflect the views of Cointelegraph.com. Every investment and trading move involves risk, you should conduct your own research when making a decision.